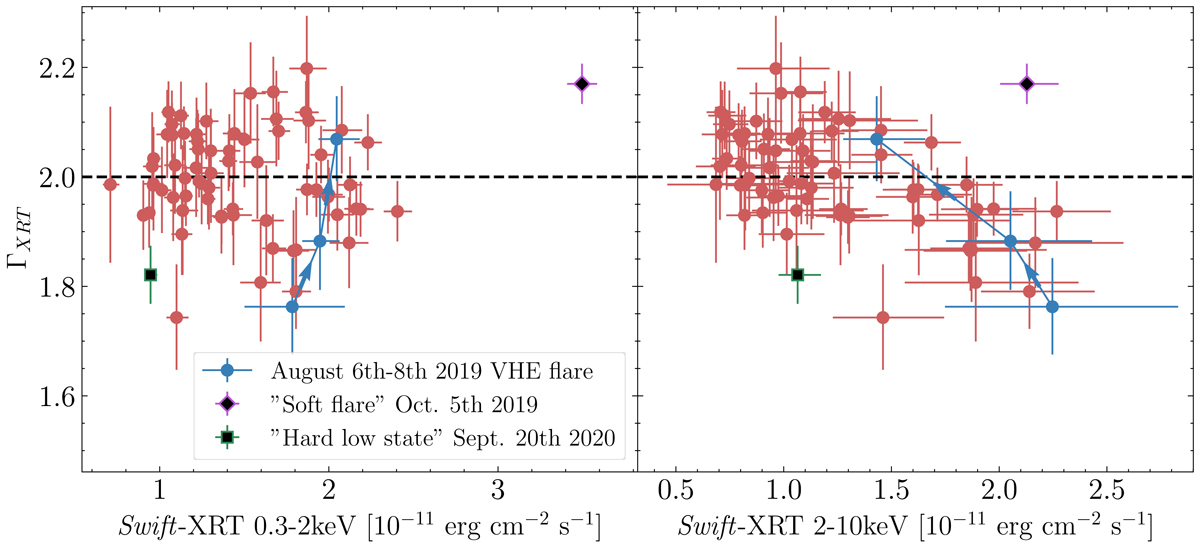
Fig. 6.
Download original image
X-ray power-law index versus flux over the multi-wavelength campaign using Swift-XRT data. Fluxes are nightly binned. The blue measurements correspond to the flaring state in August 2019 and the arrows show the direction of time. The green and violet markers correspond to the “soft flare” (October 5, 2019) and “hard low state” (September 20, 2020) periods.
Current usage metrics show cumulative count of Article Views (full-text article views including HTML views, PDF and ePub downloads, according to the available data) and Abstracts Views on Vision4Press platform.
Data correspond to usage on the plateform after 2015. The current usage metrics is available 48-96 hours after online publication and is updated daily on week days.
Initial download of the metrics may take a while.