Fig. 1.

Download original image
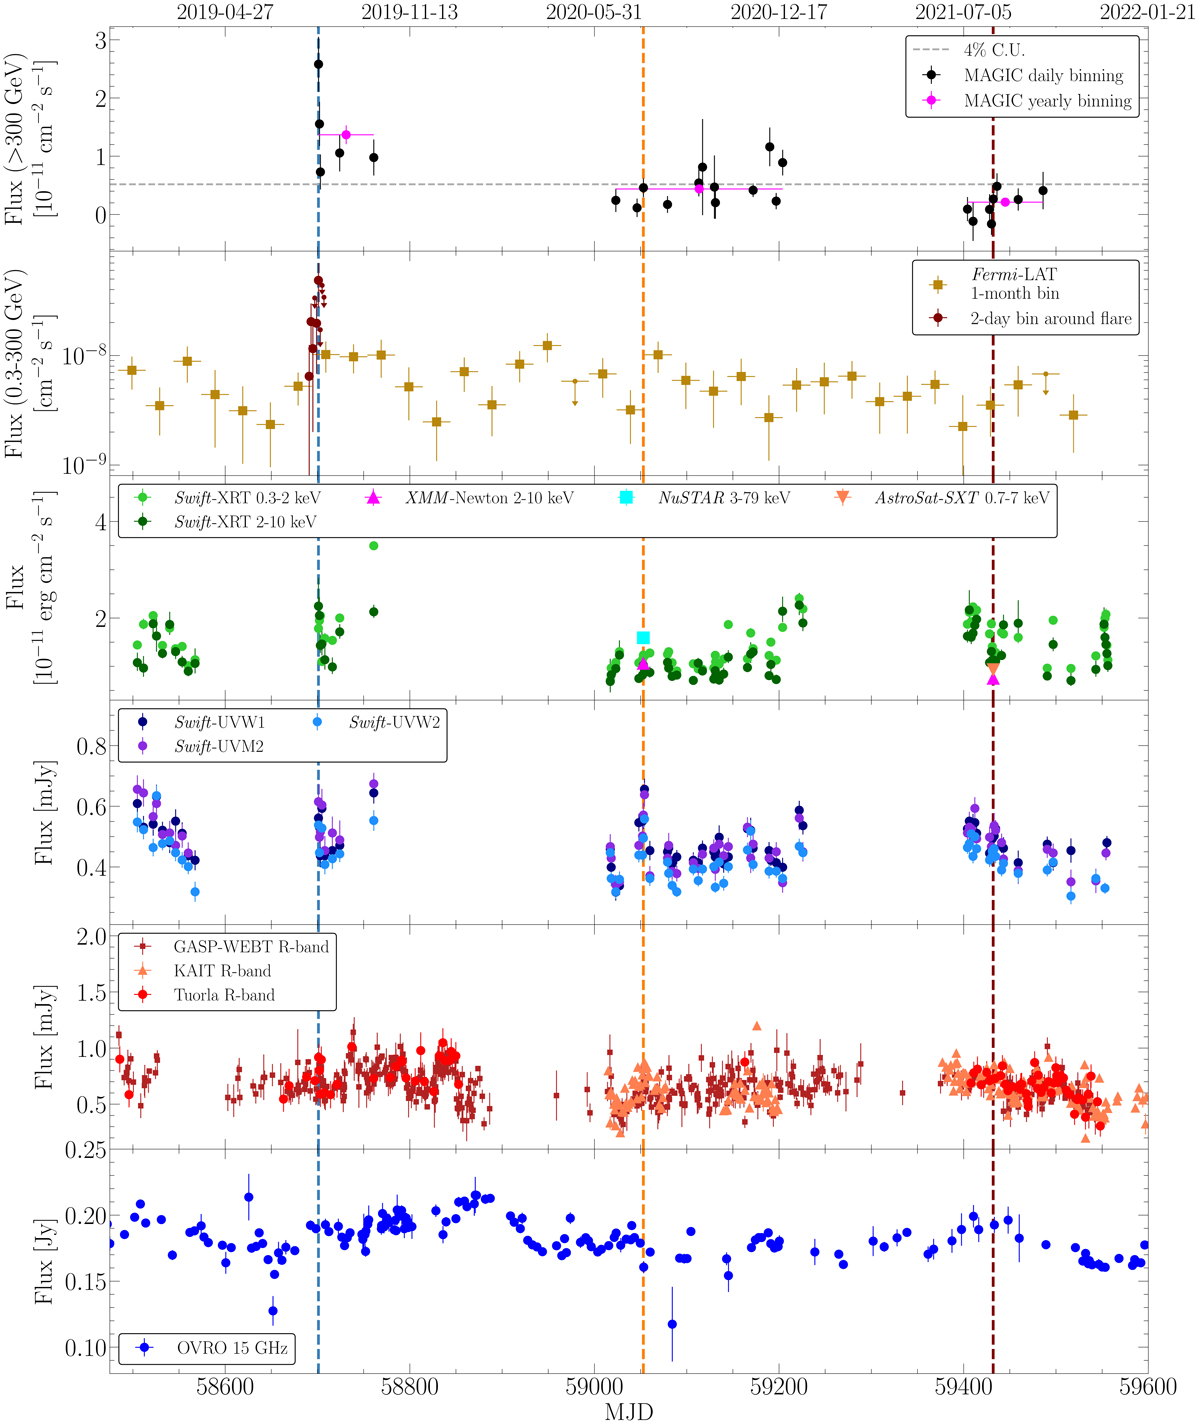
Multi-wavelength light curves between December 23, 2018 (MJD 58475) and January 21, 2022 (MJD 59600). The vertical dashed blue line highlights the date of the VHE flare detected by MAGIC in August 2019. The orange and maroon dashed vertical lines highlight the dates of the deep exposure 1 (July 23, 2020 – MJD 59053) and deep exposure 2 (August 6, 2021 – MJD 59432) epochs that contain simultaneous long observations from MAGIC, XMM-Newton, NuSTAR, and AstroSat. The top panel shows the MAGIC fluxes above 300 GeV in daily (black markers) and yearly binning (pink markers). The horizontal dashed-grey line represents 4% of the Crab Nebula flux above 300 GeV. The second panel from the top reports the Fermi-LAT fluxes in the 0.3−300 GeV band in monthly binning. An upper limit at 95% confidence level is quoted for time bins with TS < 5. The maroon markers are fluxes in 2-day binning around the VHE flare. In the third panel from the top, the Swift-XRT fluxes are shown in the 0.3−2 keV (light-green markers) and 2−10 keV (dark-green markers) bands. The NuSTAR (cyan), XMM-Newton (pink), and AstroSat-SXT2022). The grey bands correspond to the three (light red) fluxes are shown in the 3−79 keV, 2−10 keV, and 0.7−7 keV bands, respectively. The fourth panel from the top displays the UV fluxes from the Swift-UVOT instrument in the UVW1, UVM2, and UVW2 filters. The fifth panel from the top reports the fluxes in the R band from GASP-WEBT, KAIT, and Tuorla. Finally, the bottom panel shows the OVRO fluxes measured at 15 GHz.
Current usage metrics show cumulative count of Article Views (full-text article views including HTML views, PDF and ePub downloads, according to the available data) and Abstracts Views on Vision4Press platform.
Data correspond to usage on the plateform after 2015. The current usage metrics is available 48-96 hours after online publication and is updated daily on week days.
Initial download of the metrics may take a while.


