Fig. 4.
Download original image
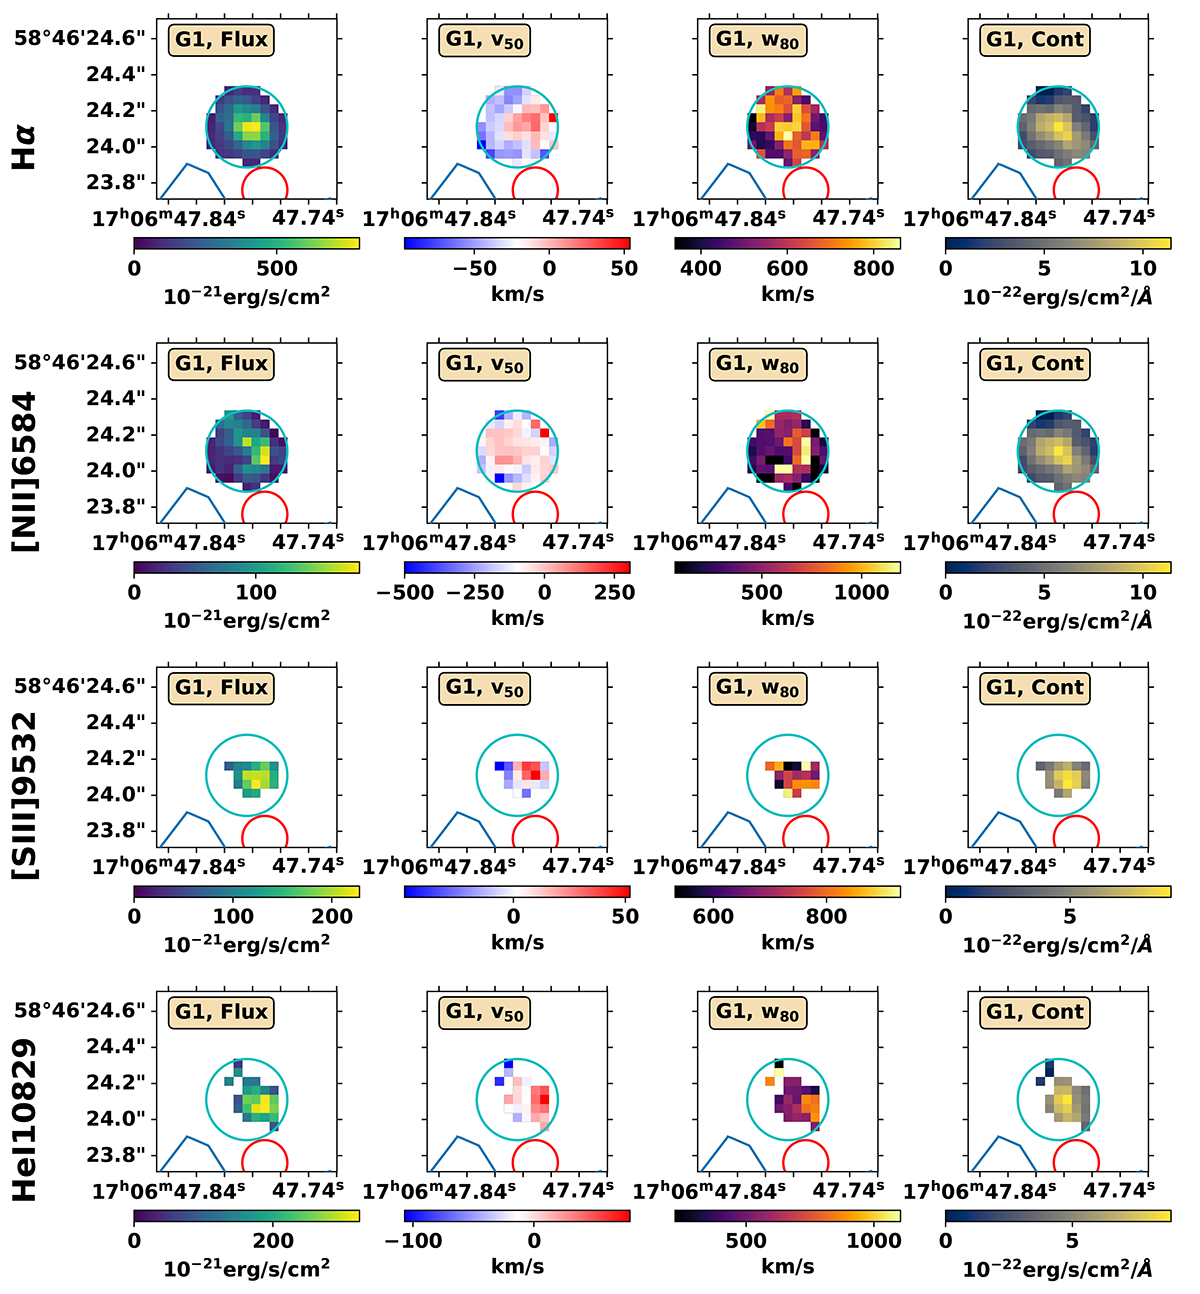
Morpho-kinematic maps of the strong emission lines detected in the component G1 (z = 3.4806). Integrated intensities are given per spaxel. The corresponding maps of [SII]λλ6716, 6731 are not presented due to low S/N. Due to the construction of our model, [NII]λ6548 has the same integrated velocity field, velocity dispersion map, and continuum map as [NII]λ6584, but an integrated intensity map that is a factor of 2.98 lower. For [SIII]λ9532 and HeIλ10829, v50 values are given with respect to their best-fit redshifts (z = 3.4810 and 3.4821, respectively).
Current usage metrics show cumulative count of Article Views (full-text article views including HTML views, PDF and ePub downloads, according to the available data) and Abstracts Views on Vision4Press platform.
Data correspond to usage on the plateform after 2015. The current usage metrics is available 48-96 hours after online publication and is updated daily on week days.
Initial download of the metrics may take a while.