Fig. 3.
Download original image
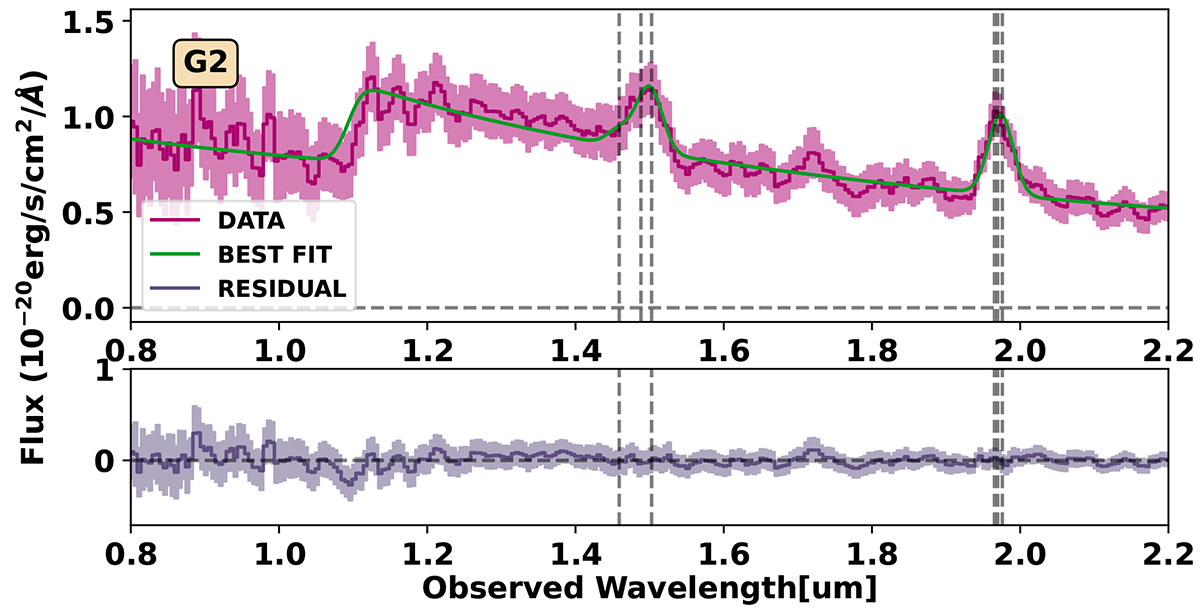
Integrated spectrum extracted from the R100 cube using the G2 mask of Fig. 1, with illustrative 1σ errors shown as shaded region. A basic fit to the data is shown by the green line. The lower panel shows the residual, with the centroids of each line depicted by dashed lines. From left to right, the lines are Hβ, [OIII]λλ4959, 5007, [NII]λ6548, Hα, and [NII]λ6584. The best-fit redshift is zG2 = 2.00 ± 0.01.
Current usage metrics show cumulative count of Article Views (full-text article views including HTML views, PDF and ePub downloads, according to the available data) and Abstracts Views on Vision4Press platform.
Data correspond to usage on the plateform after 2015. The current usage metrics is available 48-96 hours after online publication and is updated daily on week days.
Initial download of the metrics may take a while.