Fig. E.1.
Download original image
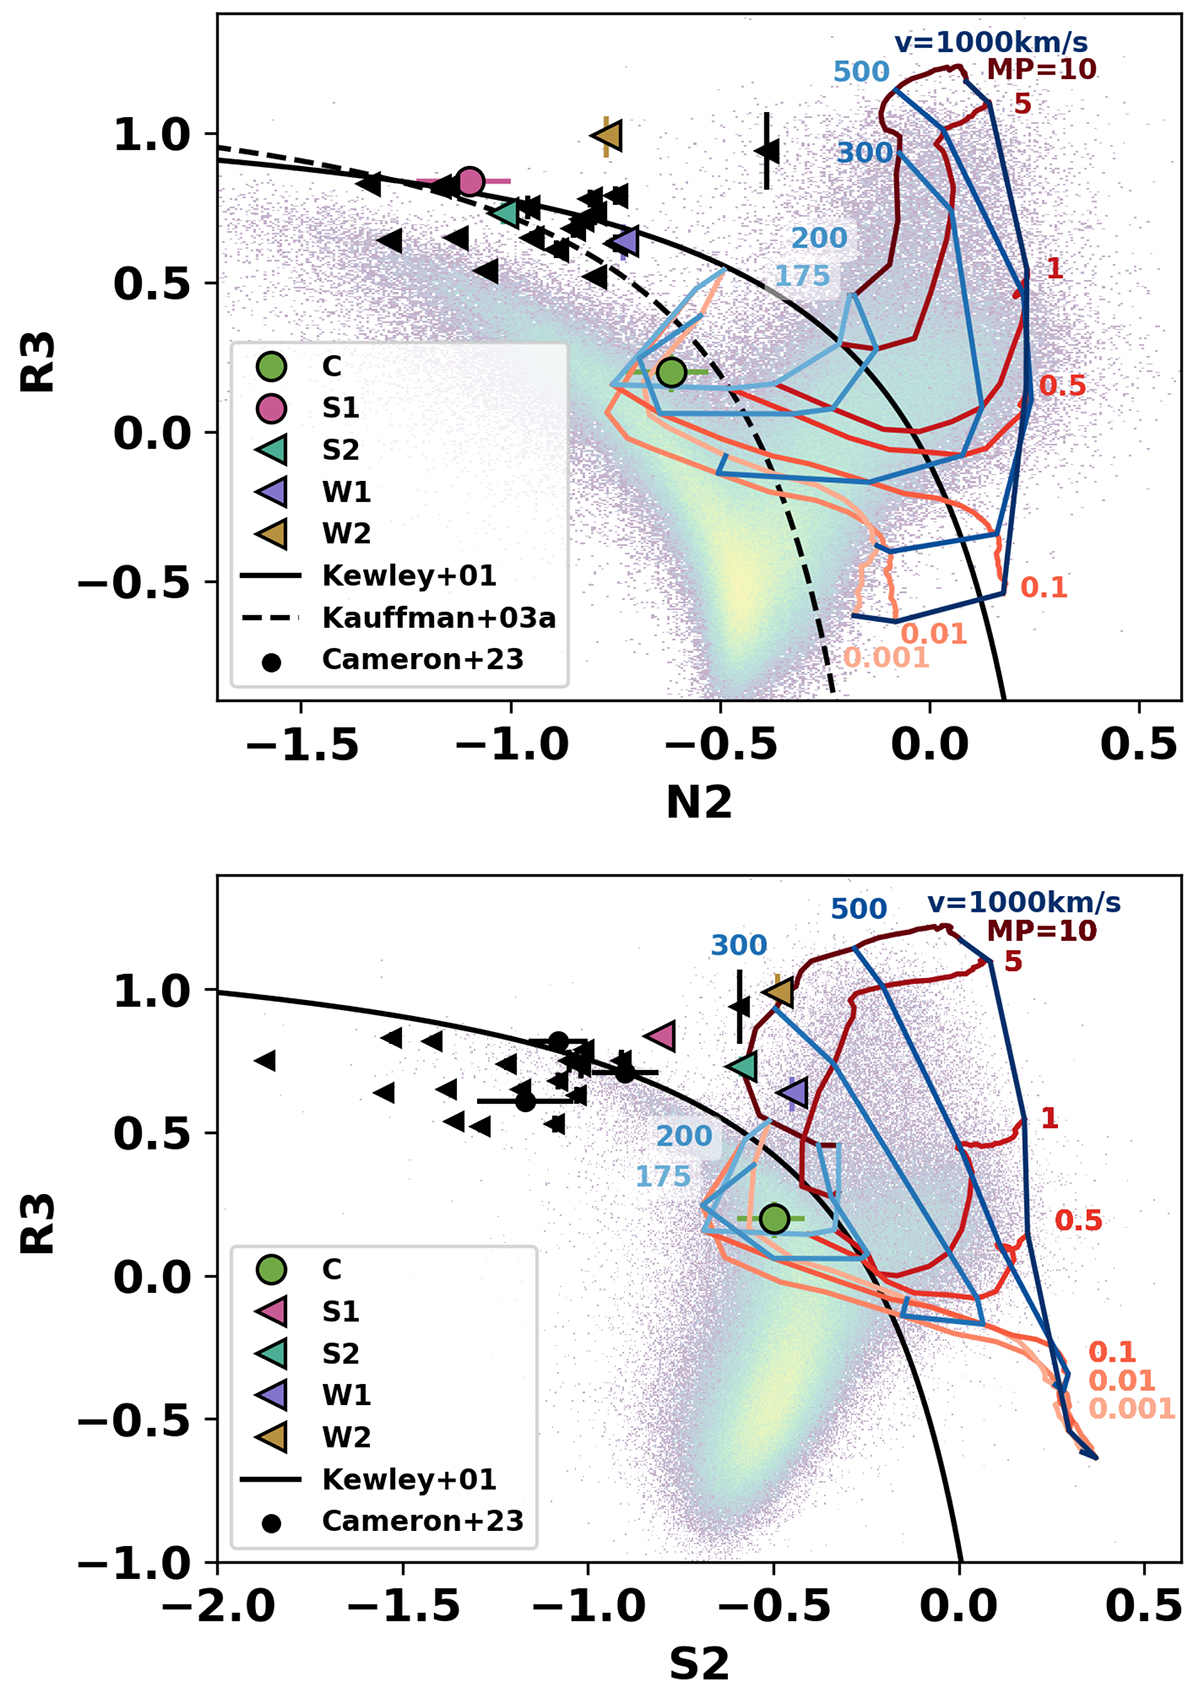
[SII]-VO87 (top) and [NII]-BPT (lower) plots created using best-fit line fluxes for each source (see the values in Table 3), as seen in Figure 9. We now include the model grids from MAPPINGS III (Allen et al. 2008). Red-shaded lines display models with a constant magnetic parameter (![]() in units of μG cm3/2), while blue-shaded lines represent models with a constant shock velocity. We assume solar metallicity, low density (n ∼ 0.1 cm−3), and no shock precursor.
in units of μG cm3/2), while blue-shaded lines represent models with a constant shock velocity. We assume solar metallicity, low density (n ∼ 0.1 cm−3), and no shock precursor.
Current usage metrics show cumulative count of Article Views (full-text article views including HTML views, PDF and ePub downloads, according to the available data) and Abstracts Views on Vision4Press platform.
Data correspond to usage on the plateform after 2015. The current usage metrics is available 48-96 hours after online publication and is updated daily on week days.
Initial download of the metrics may take a while.