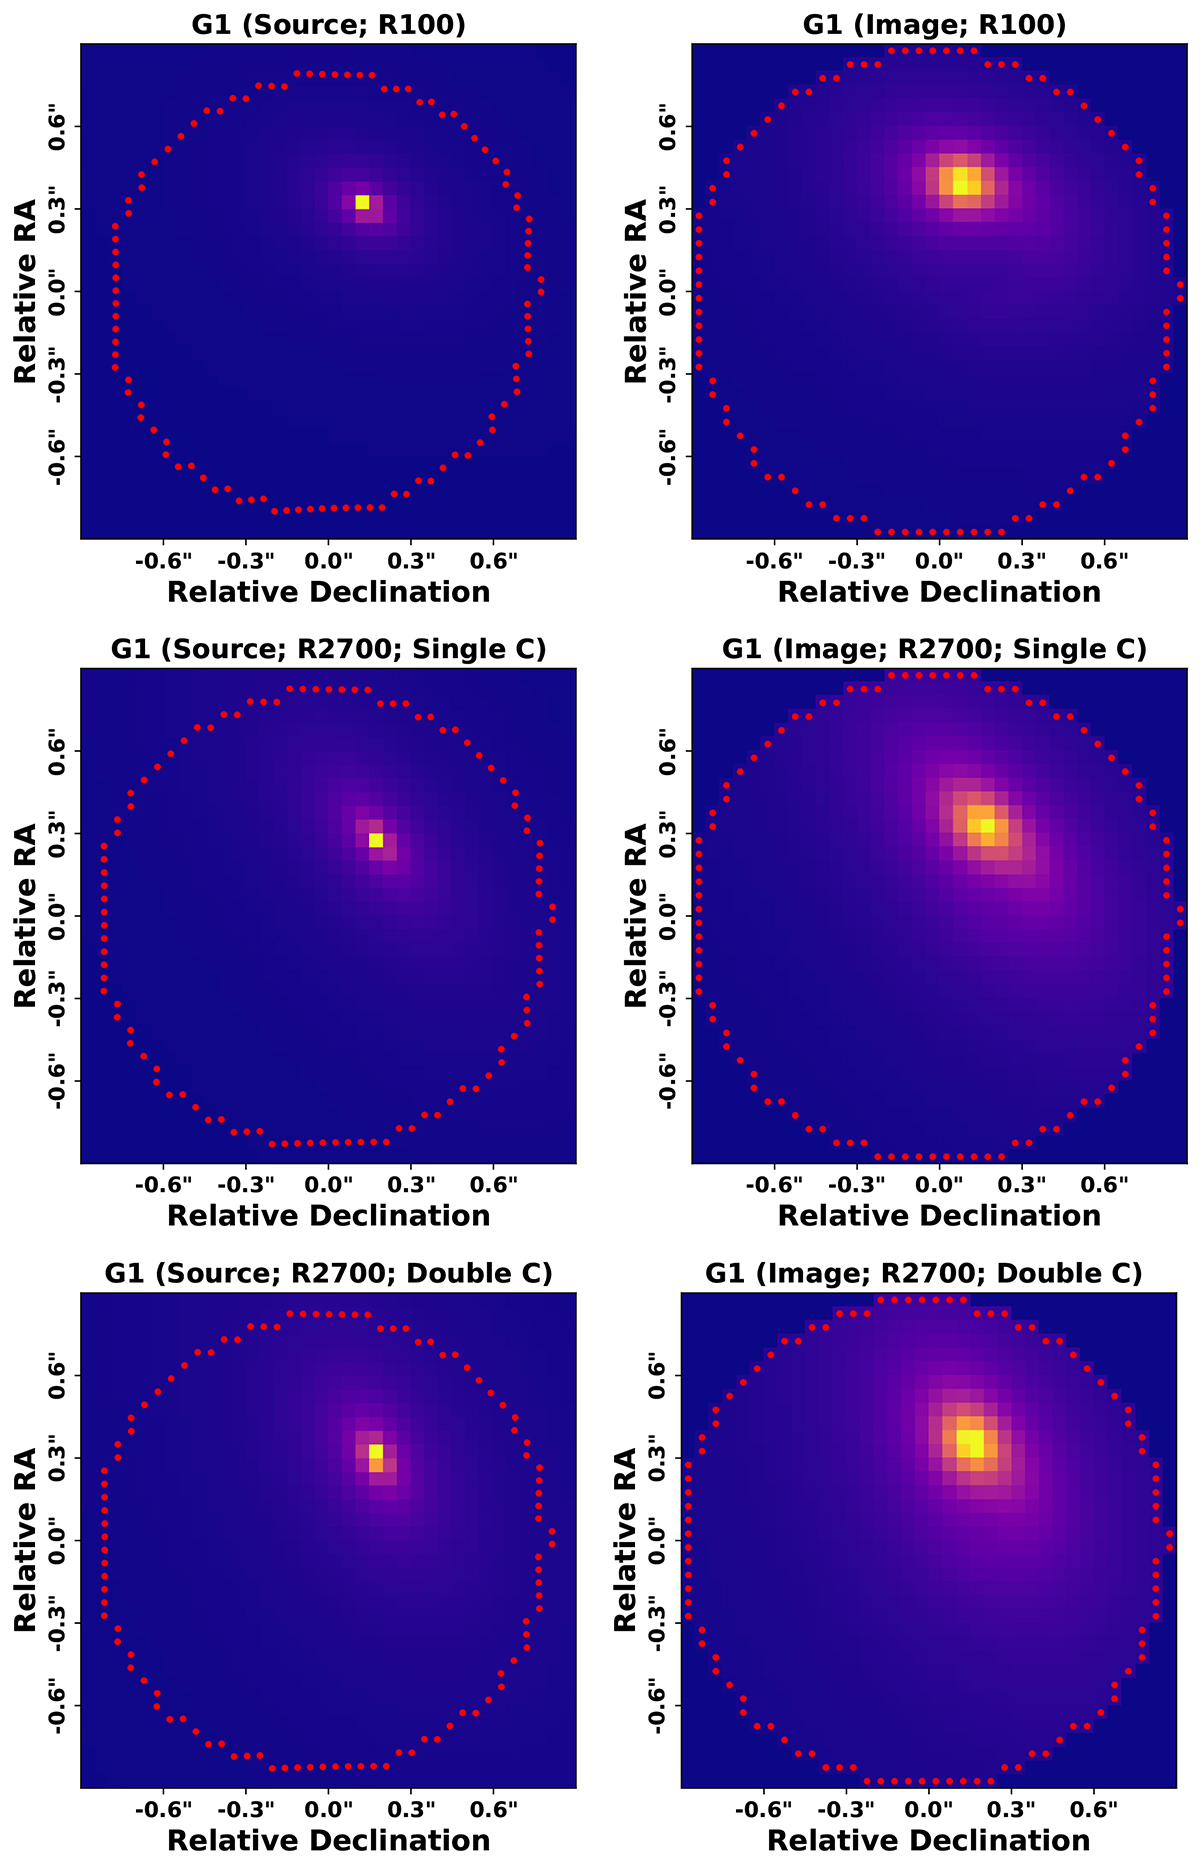
Fig. D.1.
Download original image
Best-fit source-plane (left column) and image-plane PYAUTOLENS models (right column) of G1 using the R100 cube (λ = 0.8 − 1.1 μm; top row) and the R2700 cube (λ = 4.80 − 4.85) assuming that C is composed of a single component (middle row) or two components (lower row). Mass and light profiles are assumed to be Sérsic and isothermal ellipse profiles, respectively. The outline of the spatial mask is shown by red markers.
Current usage metrics show cumulative count of Article Views (full-text article views including HTML views, PDF and ePub downloads, according to the available data) and Abstracts Views on Vision4Press platform.
Data correspond to usage on the plateform after 2015. The current usage metrics is available 48-96 hours after online publication and is updated daily on week days.
Initial download of the metrics may take a while.