Fig. B.1.
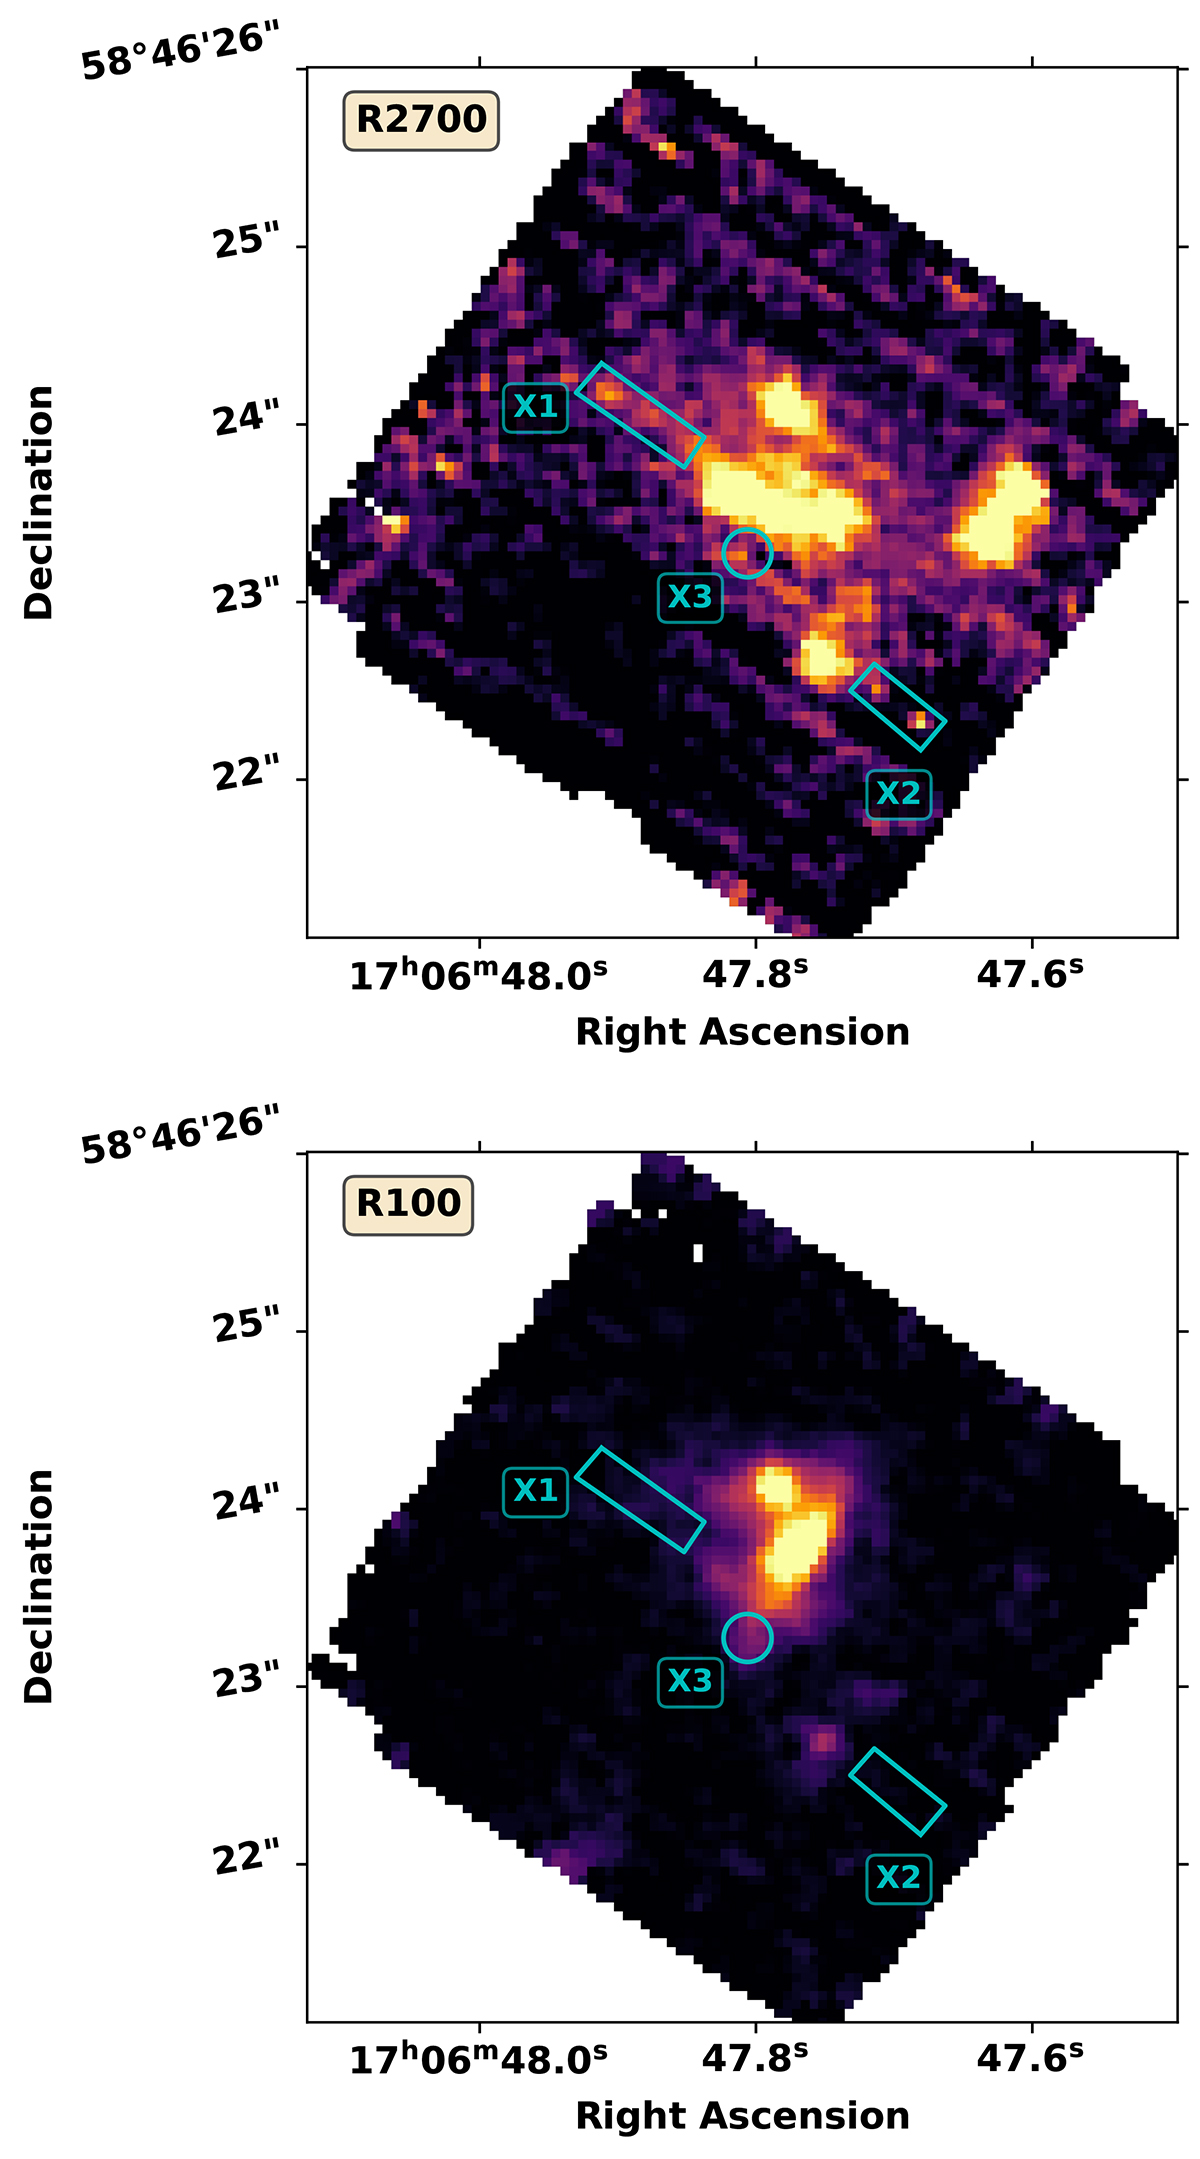
Download original image
Integrated emission of the HFLS3 field, using the same illustrative wavelength ranges as in Fig. 1: redshifted Hα for z ∼ 6.34 for the R2700 cube (λobs = 4.79954 − 4.84467 μm, upper panel) and the approximate wavelength range of HST/WFC3 F160W for the R100 cube (λobs = 1.4 − 1.6 μm; lower panel). The colour scale has been adjusted to highlight weak emission. Low-level candidate galaxies are shown with cyan boundaries. North is up and east is to the left.
Current usage metrics show cumulative count of Article Views (full-text article views including HTML views, PDF and ePub downloads, according to the available data) and Abstracts Views on Vision4Press platform.
Data correspond to usage on the plateform after 2015. The current usage metrics is available 48-96 hours after online publication and is updated daily on week days.
Initial download of the metrics may take a while.