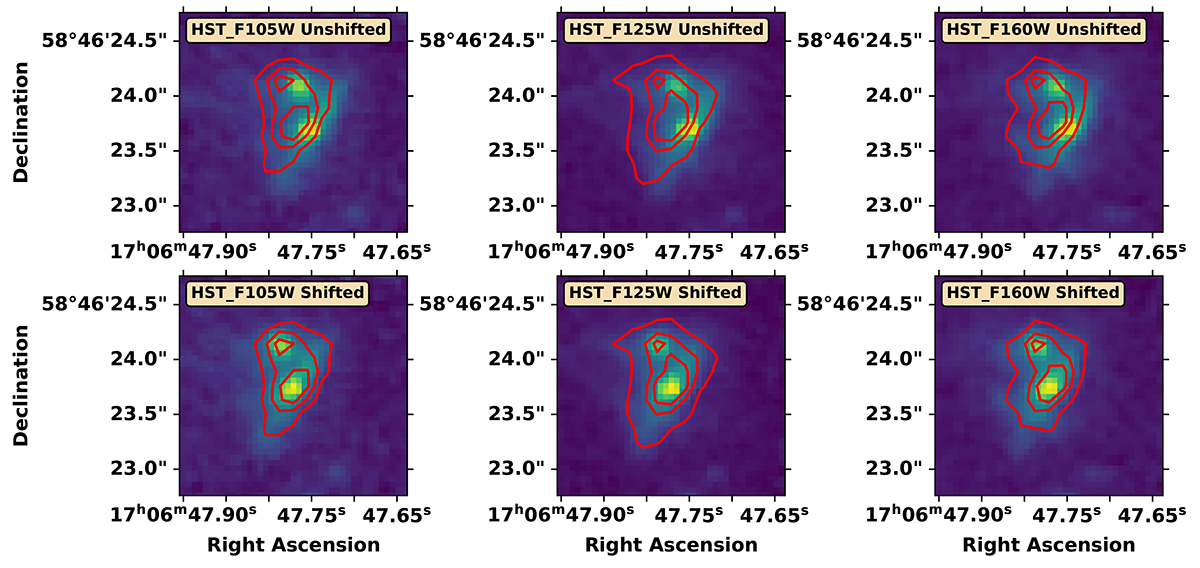
Fig. A.2.
Download original image
JWST/NIRSpec IFU R100 data cubes integrated over the corresponding HST filter bandpasses: F105W (left), F125W (centre), and F160W (right). In each panel, the collapsed JWST emission is depicted as the background colours, while the HST data are shown as red contours. The JWST emission in the top row is shown without the astrometric correction, while the lower row includes the alignment to Gaia DR3 data.
Current usage metrics show cumulative count of Article Views (full-text article views including HTML views, PDF and ePub downloads, according to the available data) and Abstracts Views on Vision4Press platform.
Data correspond to usage on the plateform after 2015. The current usage metrics is available 48-96 hours after online publication and is updated daily on week days.
Initial download of the metrics may take a while.