Fig. A.1.
Download original image
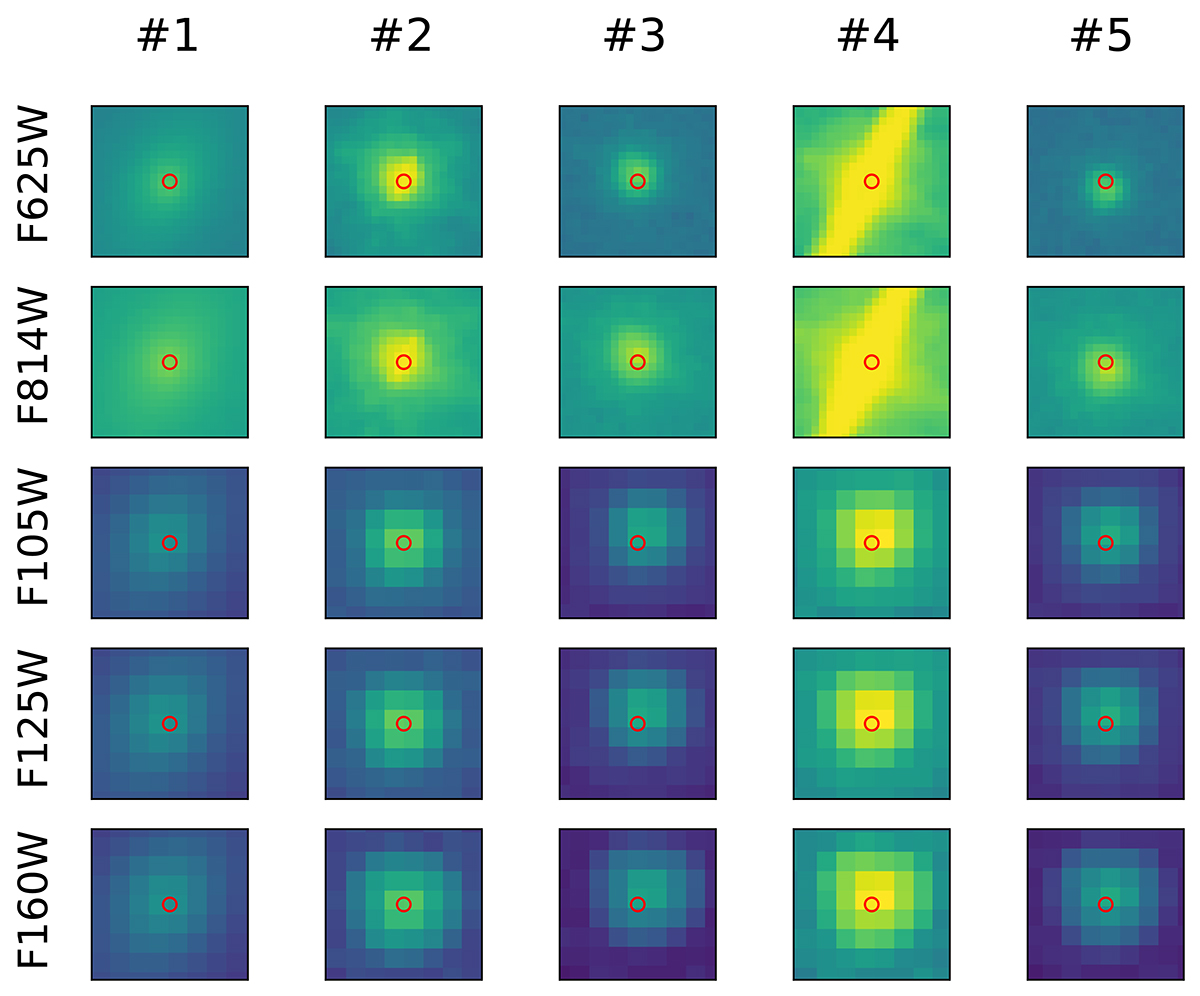
Verification that HST images have been aligned to the Gaia DR3 reference frame. Each panel contains a 1″ × 1″ view of an HST image (see the labels for each row) that is focused on a given location from the Gaia archive (see the labels for each column). The Gaia position is shown as a 0.1″ diameter red circle. The locations of each Gaia source are listed in Table A.1.
Current usage metrics show cumulative count of Article Views (full-text article views including HTML views, PDF and ePub downloads, according to the available data) and Abstracts Views on Vision4Press platform.
Data correspond to usage on the plateform after 2015. The current usage metrics is available 48-96 hours after online publication and is updated daily on week days.
Initial download of the metrics may take a while.