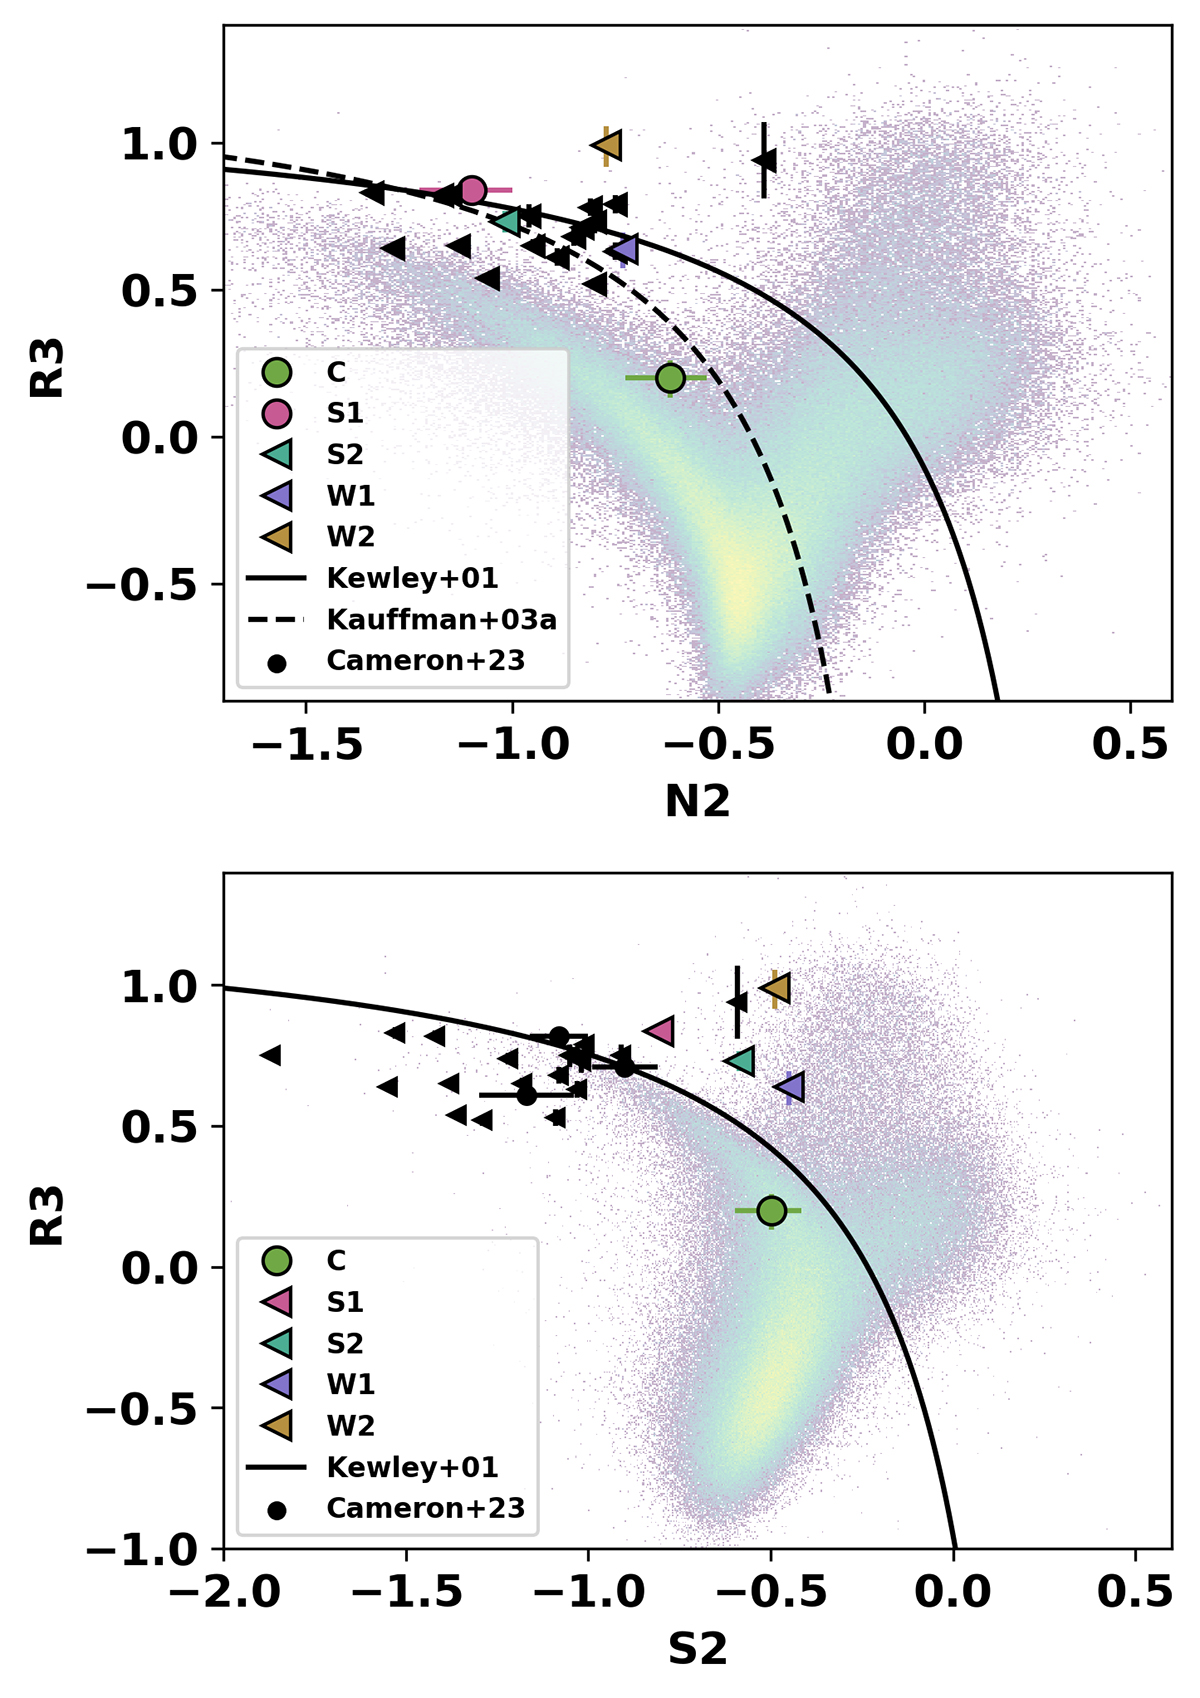
Fig. 9.
Download original image
[SII]-VO87 (upper) and [NII]-BPT (lower) plots created using best-fit line fluxes for each source (see the values in Table 3). The distributions of low-redshift galaxies from SDSS (MPA-JHU DR8 catalogue; Kauffmann et al. 2003b; Brinchmann et al. 2004) are shown as background points. Left-facing arrows represent 3σ upper limits on N2 and S2. We include the demarcation lines for the z ∼ 0 galaxies of Kewley et al. (2001, solid lines) and Kauffmann et al. (2003a, dashed line). We compare our results with values from z ∼ 5.5 − 7.0 galaxies observed with JWST/NIRSpec MSA as part of the JADES survey (Cameron et al. 2023; black symbols).
Current usage metrics show cumulative count of Article Views (full-text article views including HTML views, PDF and ePub downloads, according to the available data) and Abstracts Views on Vision4Press platform.
Data correspond to usage on the plateform after 2015. The current usage metrics is available 48-96 hours after online publication and is updated daily on week days.
Initial download of the metrics may take a while.