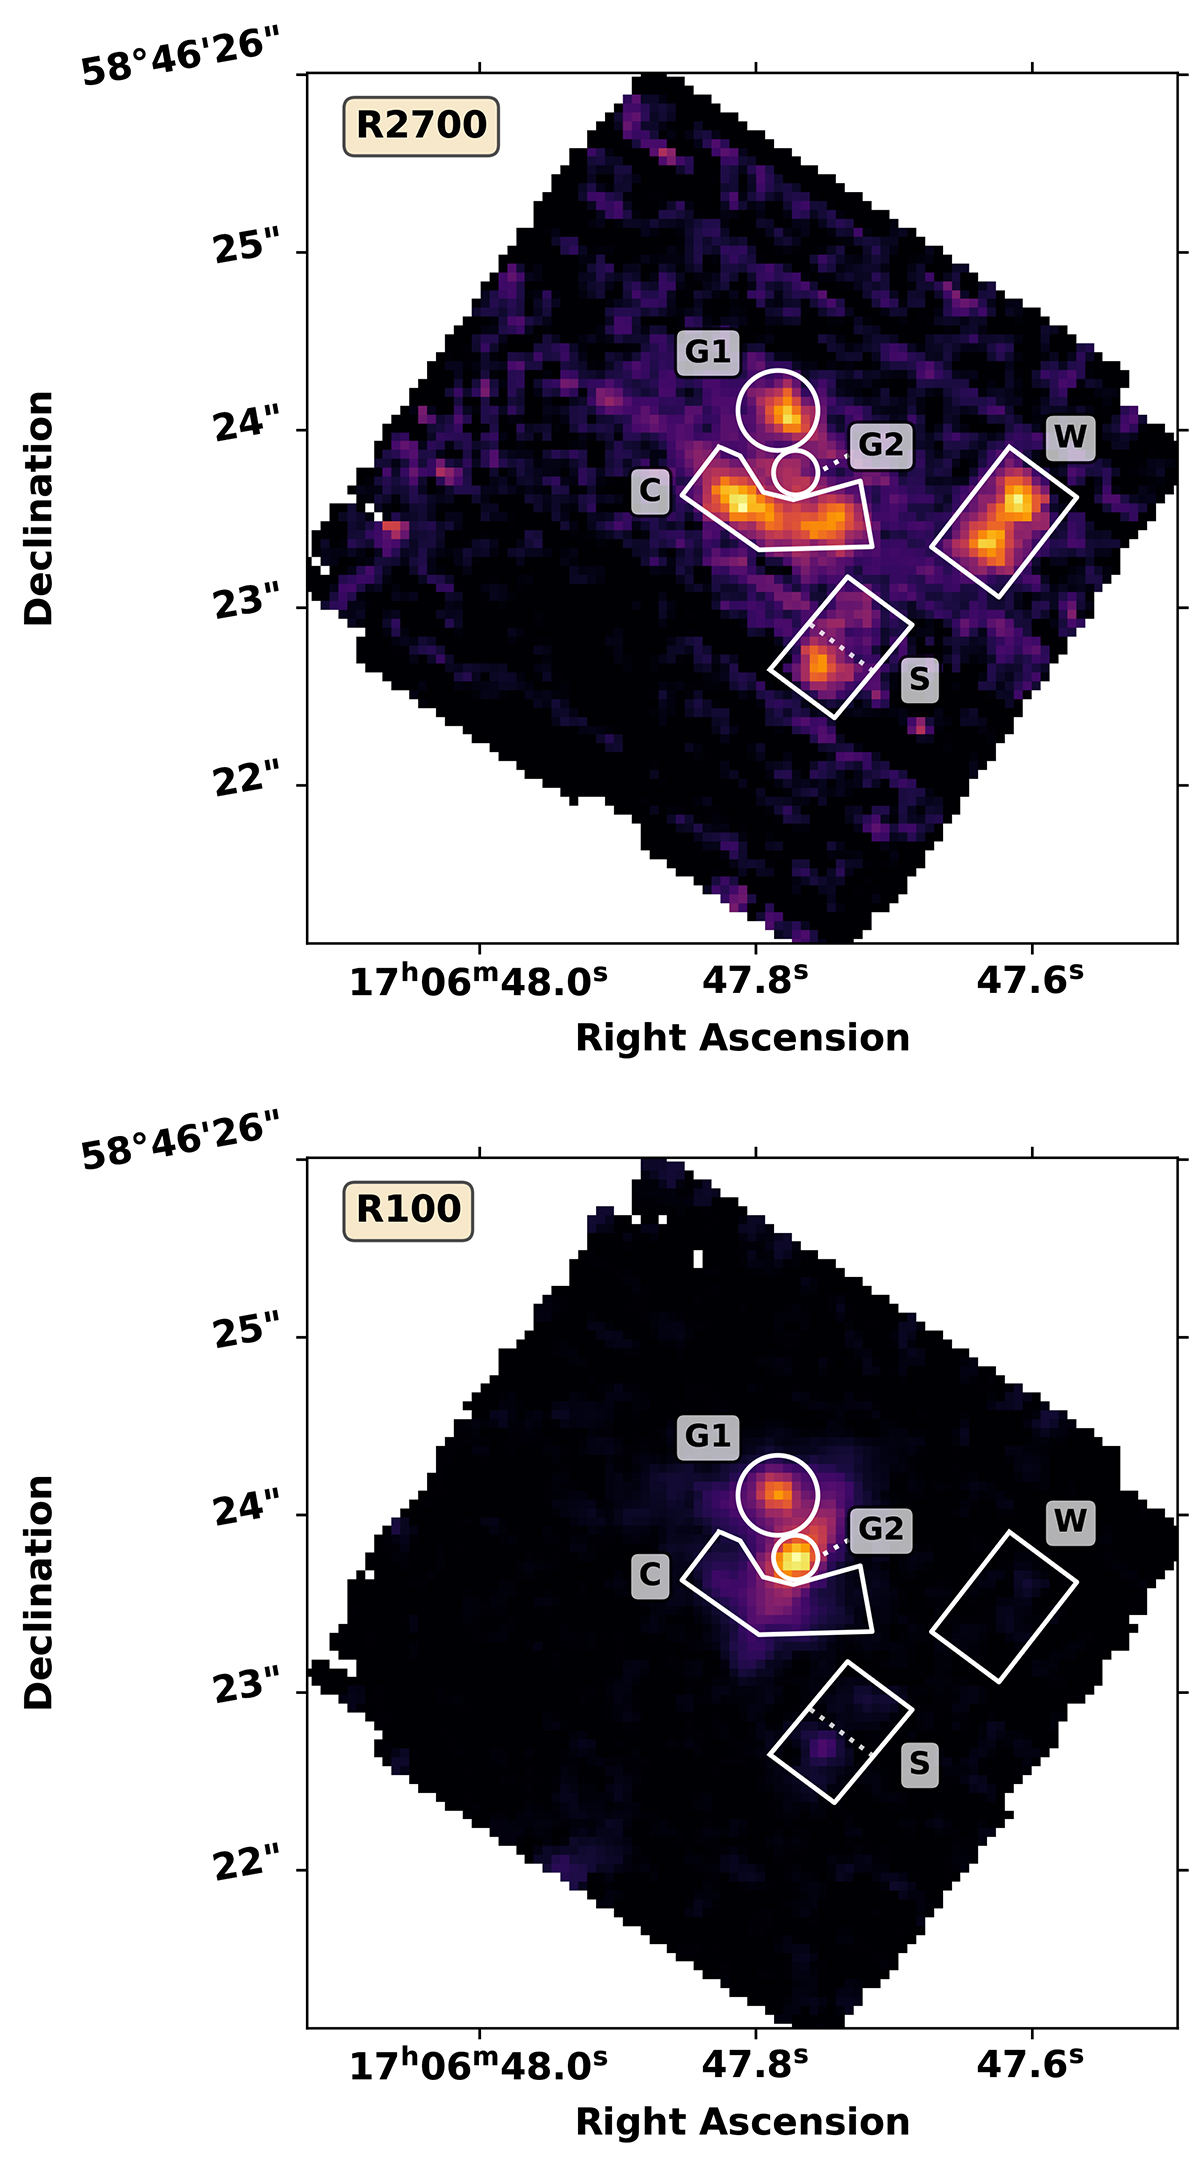
Fig. 1.
Download original image
Integrated emission of the HFLS3 field, using two illustrative wavelength ranges: redshifted Hα for z ∼ 6.34 for the R2700 cube (λobs = 4.79954 − 4.84467 μm, upper panel) and the approximate wavelength range of HST/WFC3 F160W for the R100 cube (λobs = 1.4 − 1.6 μm; lower panel). The adopted source masks are shown with white boundaries. North is up and east is to the left. The lower panel is nearly identical to the observed HST/WFC3 F160W image, but at a higher spatial resolution (see Fig. A.2).
Current usage metrics show cumulative count of Article Views (full-text article views including HTML views, PDF and ePub downloads, according to the available data) and Abstracts Views on Vision4Press platform.
Data correspond to usage on the plateform after 2015. The current usage metrics is available 48-96 hours after online publication and is updated daily on week days.
Initial download of the metrics may take a while.