Fig. 7.
Download original image
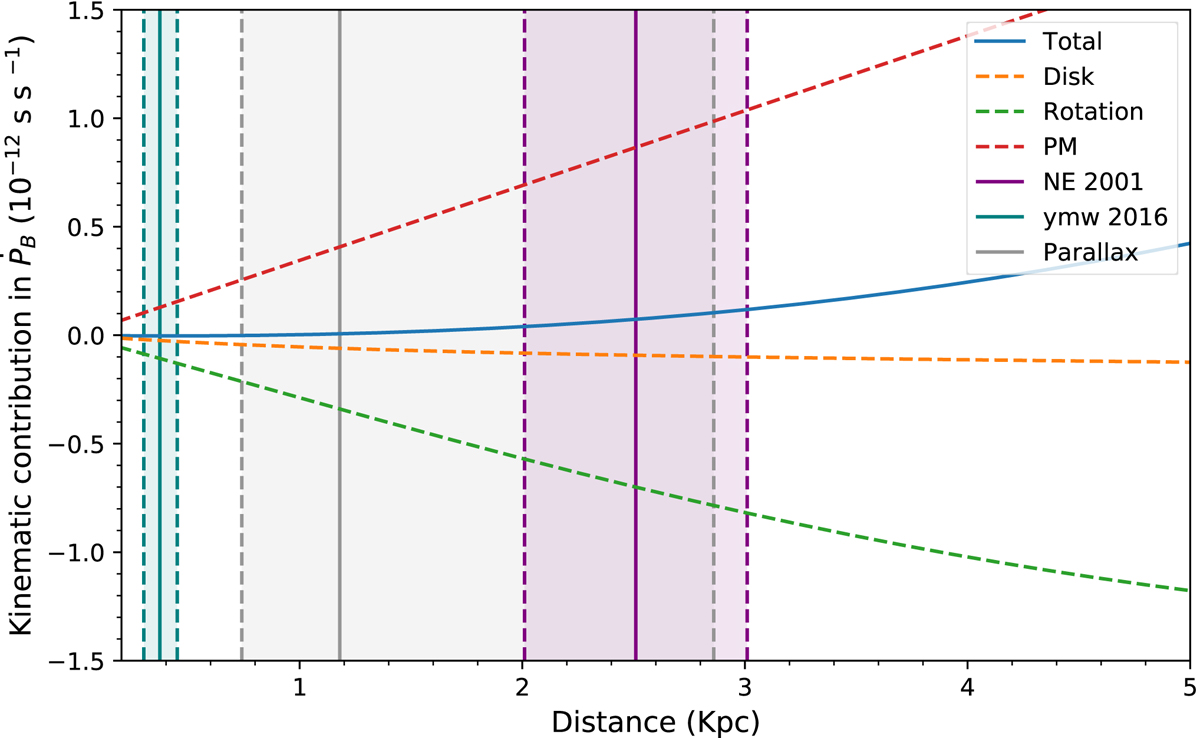
Acceleration contributions to the orbital period derivative due to kinematic effects as a function of distance. Orange and green curves show the vertical and differential accelerations from the Galactic disc, while the red curve shows the contribution from the proper motion of the pulsar. The blue curve represents the total acceleration contribution. A distance uncertainty of 20% is assumed on the DM distance predictions from the NE2001 model (purple shaded region) and the YMW16 model (teal shaded region), while the 1σ uncertainty is shown for the parallax measurement from timing (grey shaded region).
Current usage metrics show cumulative count of Article Views (full-text article views including HTML views, PDF and ePub downloads, according to the available data) and Abstracts Views on Vision4Press platform.
Data correspond to usage on the plateform after 2015. The current usage metrics is available 48-96 hours after online publication and is updated daily on week days.
Initial download of the metrics may take a while.