Fig. 4.
Download original image
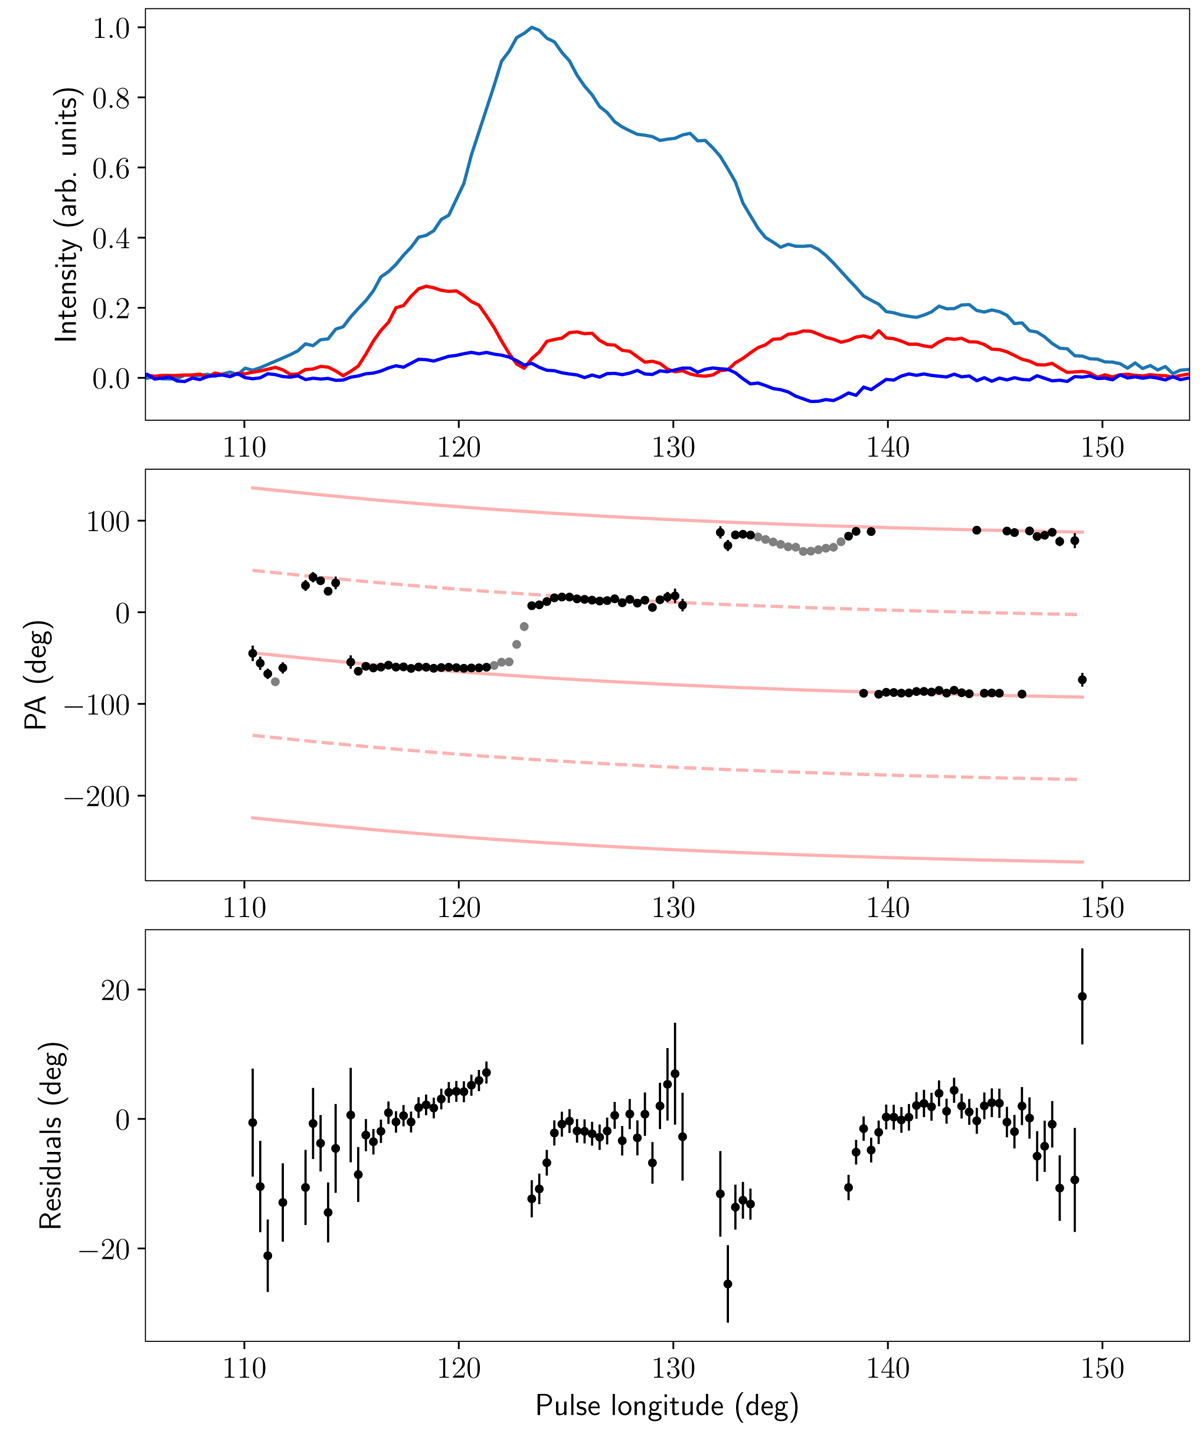
RVM fit with the polarised pulse profile. Top plot: Zoom into the region of the radio pulse of PSR J1012−4235; we can see more clearly how the polarised emission changes with spin phase, or longitude. The colours are as in Fig. 2. Middle plot: Position angle as a function of the longitude. The black dots indicate the measured PA angles for the linearly polarised emission, and the smooth red curves (solid and dashed) indicate the prediction of the best-fit model. Polarisations that are 180 deg apart are identical. Polarisations 90 deg apart correspond to changes to OPMs. Lower plot: Differences between the measured PAs and the nearest model prediction accounting for possible OPM changes, i.e. the PA residuals.
Current usage metrics show cumulative count of Article Views (full-text article views including HTML views, PDF and ePub downloads, according to the available data) and Abstracts Views on Vision4Press platform.
Data correspond to usage on the plateform after 2015. The current usage metrics is available 48-96 hours after online publication and is updated daily on week days.
Initial download of the metrics may take a while.