Open Access
Fig. 1.
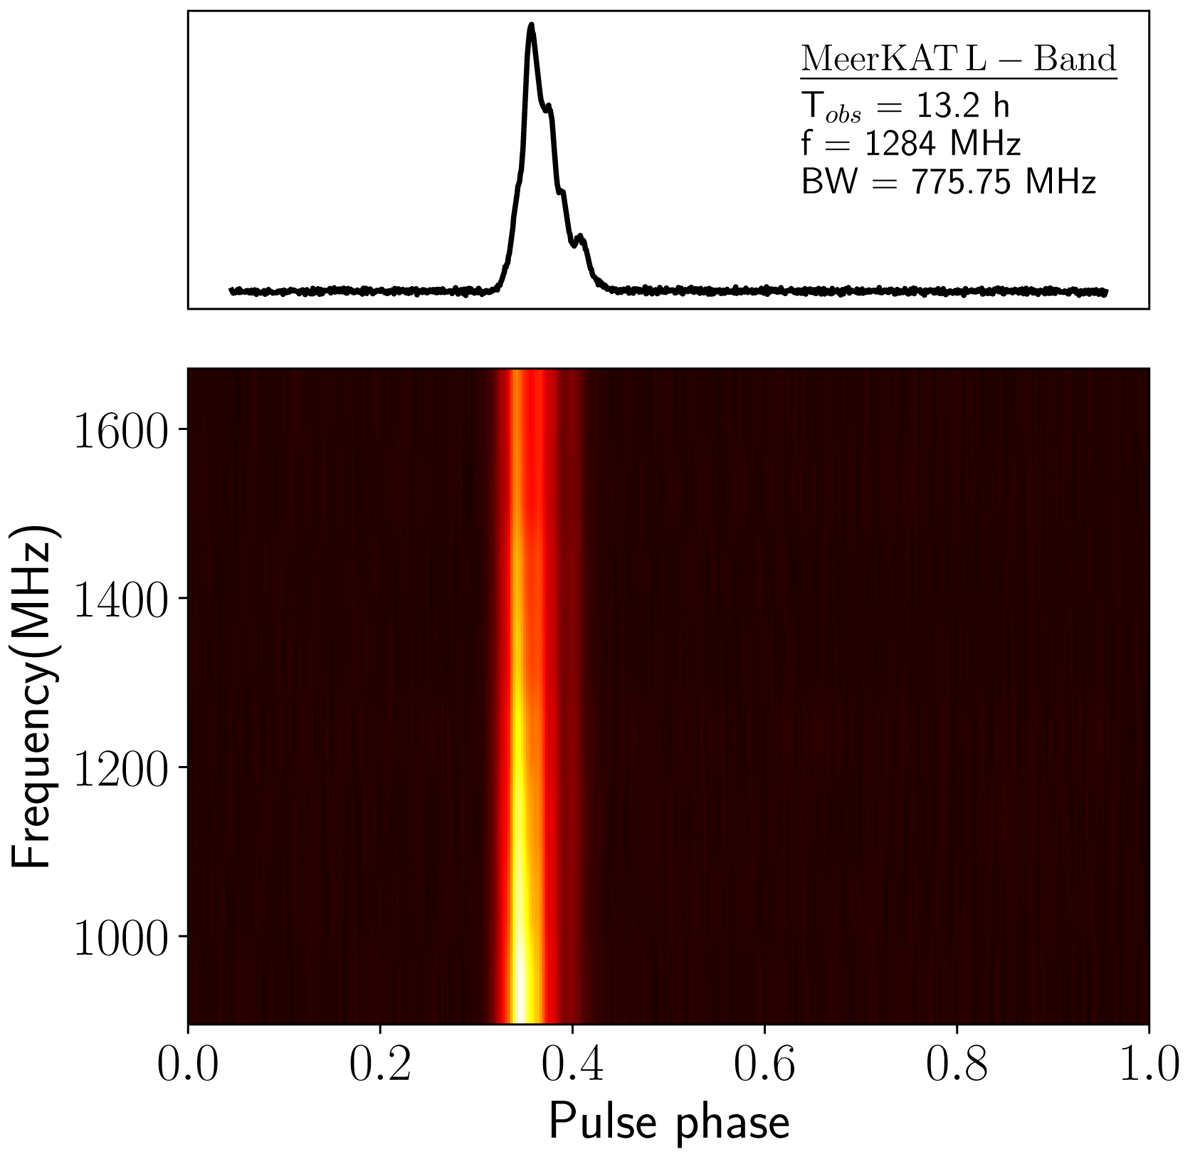
Download original image
MeerKAT L-Band profile obtained by integrating a total of 13.2 h of data. Top plot: Intensity versus rotation phase. Bottom plot: Radio frequency versus rotation phase. In this latter plot, we can see how the pulse profile evolves with radio frequency. The number of phase bins was 1024 and the S/N is 977.
Current usage metrics show cumulative count of Article Views (full-text article views including HTML views, PDF and ePub downloads, according to the available data) and Abstracts Views on Vision4Press platform.
Data correspond to usage on the plateform after 2015. The current usage metrics is available 48-96 hours after online publication and is updated daily on week days.
Initial download of the metrics may take a while.