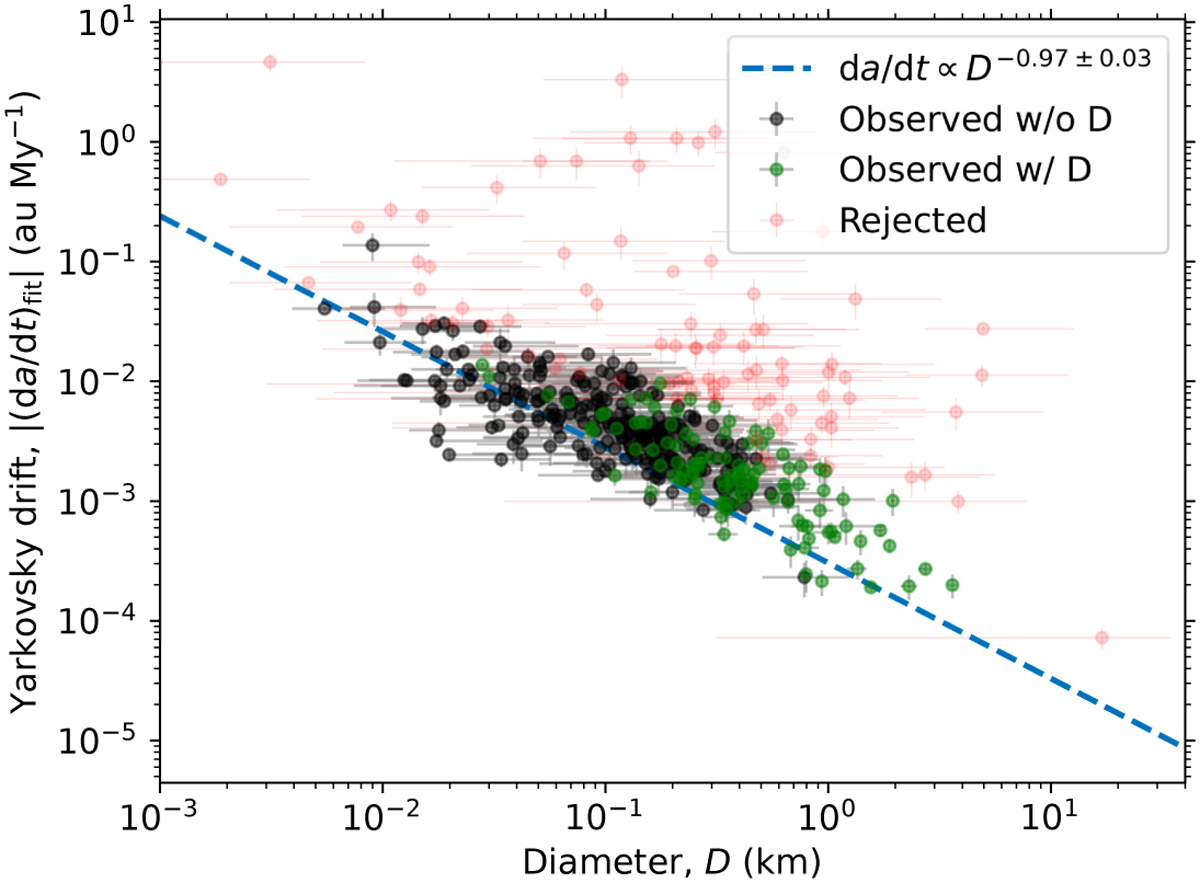
Fig. 4
Download original image
Distribution of the accepted Yarkovsky effect detections in the plane (D, |(da/dt)fit|). Green points are NEAs for which an estimate of the diameter is available, while black points are those for which the physical model is used. The error bars in the diameter are represented by using the 15th and 85th percentile of the diameter distribution (see Sect. 2.2.2), which roughly correspond to the 1-σ uncertainty in the case the diameter is estimated. The error bars in the semi-major axis drift represent the 1-σ uncertainty obtained by the conversion of A2, that has been estimated with orbit determination. The dashed blue line represents the fit with a function of the form α× Dβ. Red points are detections with S/N ≥ 3 that are considered spurious, hence rejected by our procedure.
Current usage metrics show cumulative count of Article Views (full-text article views including HTML views, PDF and ePub downloads, according to the available data) and Abstracts Views on Vision4Press platform.
Data correspond to usage on the plateform after 2015. The current usage metrics is available 48-96 hours after online publication and is updated daily on week days.
Initial download of the metrics may take a while.