Open Access
Fig. 3
Download original image
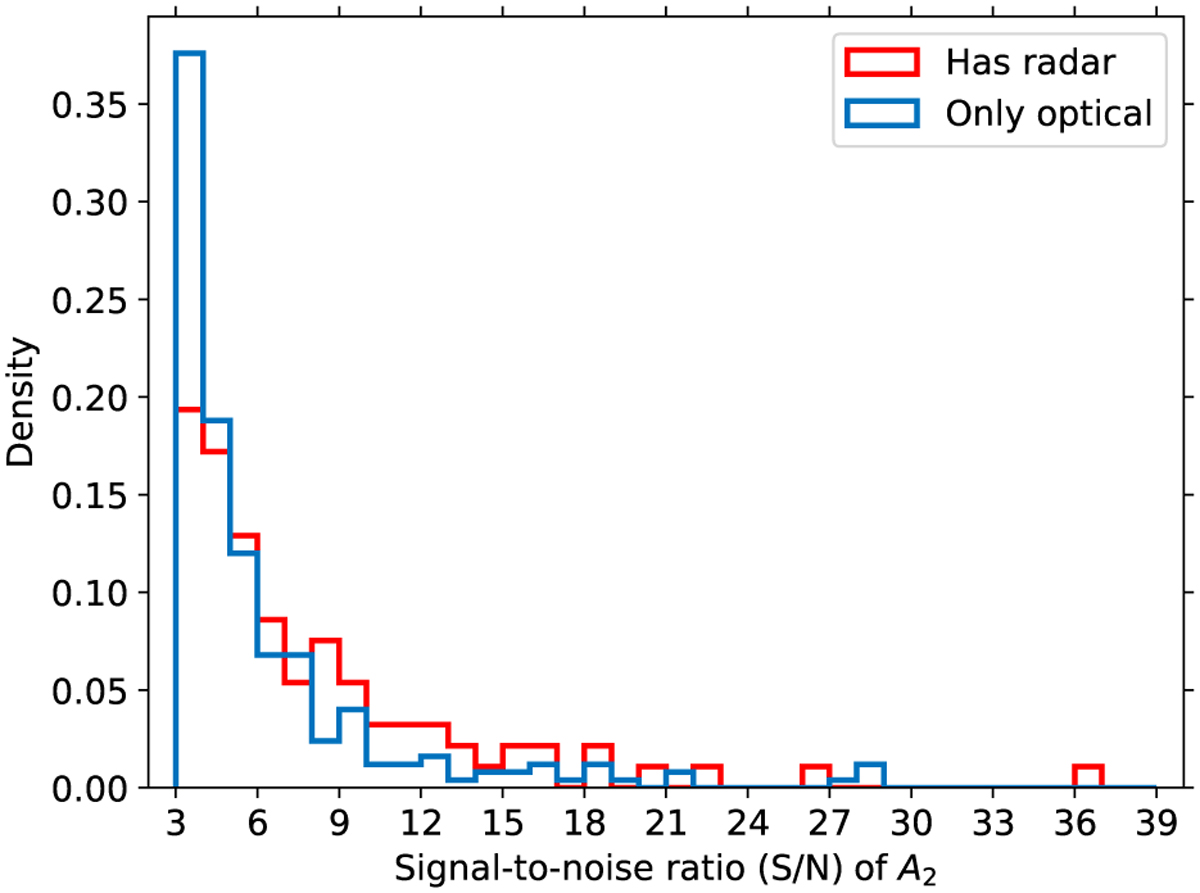
Distribution of the S/N of the accepted Yarkovsky effect detections, obtained with equi-spaced bins of width equal to 1. NEAs with only optical observations are represented in the blue histogram, while the red histogram refers to NEAs observed also with radar.
Current usage metrics show cumulative count of Article Views (full-text article views including HTML views, PDF and ePub downloads, according to the available data) and Abstracts Views on Vision4Press platform.
Data correspond to usage on the plateform after 2015. The current usage metrics is available 48-96 hours after online publication and is updated daily on week days.
Initial download of the metrics may take a while.