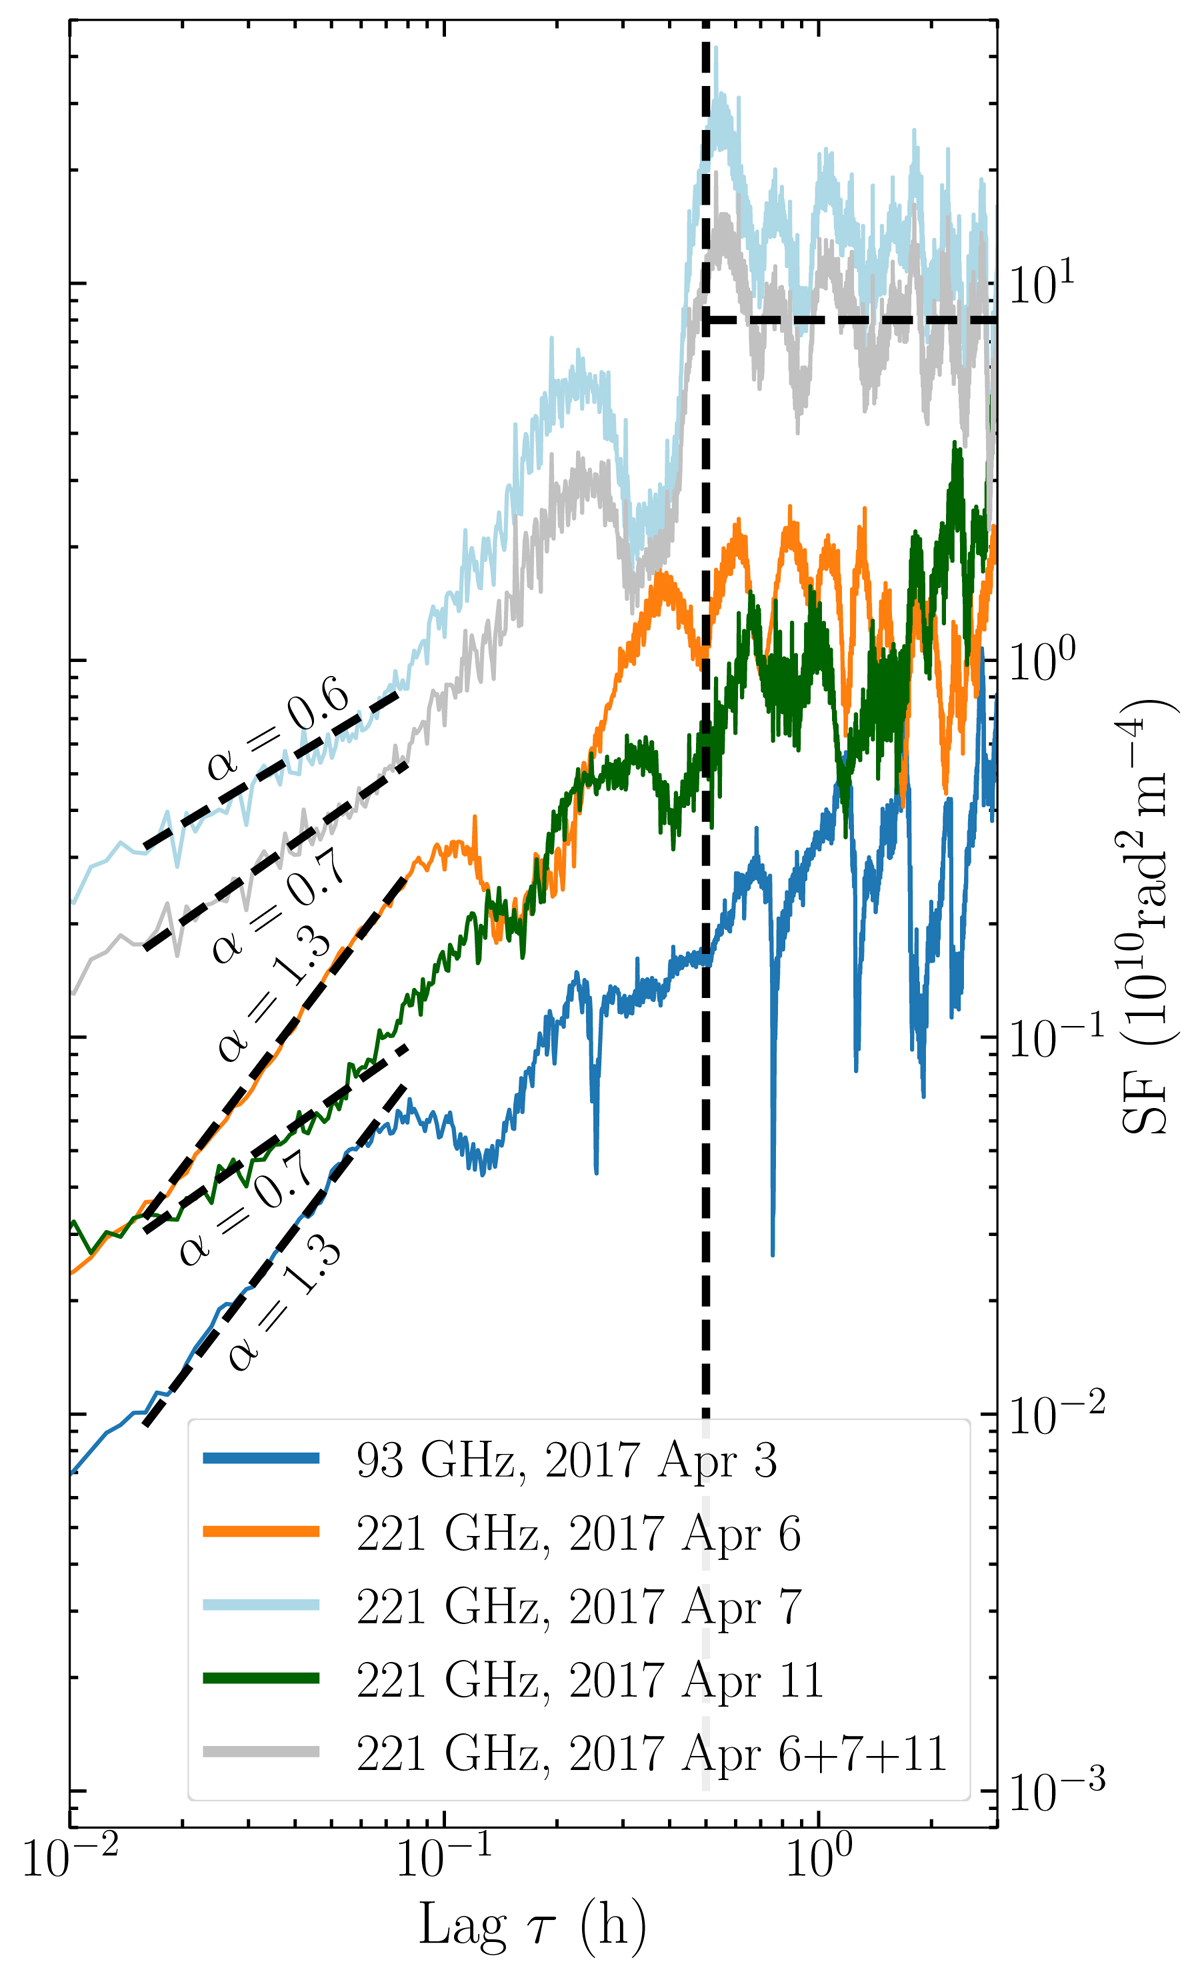
Fig. A.1.
Download original image
SF analysis of the RM variability at 93 GHz and 221 GHz separately for the three observing days, and combined. The figure shows more absolute variability at 221 GHz in all cases, with a typically less steep SF slope at the short timescales range than in case of 93 GHz. A 0.5 h variability decorrelation timescale, corresponding to flattening of the SF at longer timescales, is found for some 221 GHz RM data sets, and appears absent at 93 GHz.
Current usage metrics show cumulative count of Article Views (full-text article views including HTML views, PDF and ePub downloads, according to the available data) and Abstracts Views on Vision4Press platform.
Data correspond to usage on the plateform after 2015. The current usage metrics is available 48-96 hours after online publication and is updated daily on week days.
Initial download of the metrics may take a while.