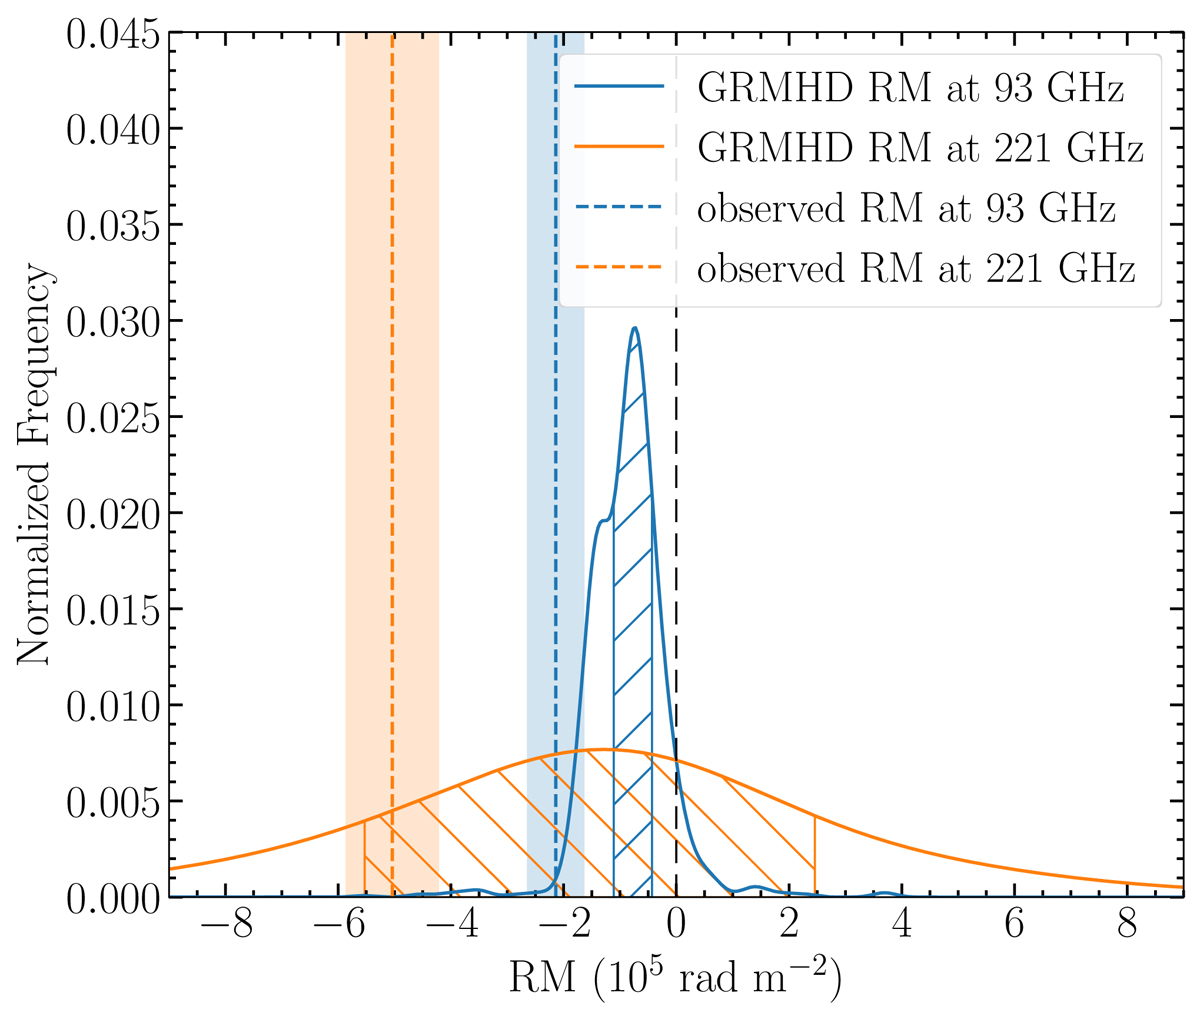
Fig. 8.
Download original image
Smoothed histograms of RM extracted from the GRMHD simulation (sign-flipped and shifted by the Galactic Center magnetar RM = −7 × 10⁴ rad m−2) compared to the ranges inferred from observations on 2017 April 3 and 6, discussed in Sect. 2.4 (vertical bands). Shaded and hatched regions denote intervals containing 68% of the distribution around the median value.
Current usage metrics show cumulative count of Article Views (full-text article views including HTML views, PDF and ePub downloads, according to the available data) and Abstracts Views on Vision4Press platform.
Data correspond to usage on the plateform after 2015. The current usage metrics is available 48-96 hours after online publication and is updated daily on week days.
Initial download of the metrics may take a while.