Fig. 7.
Download original image
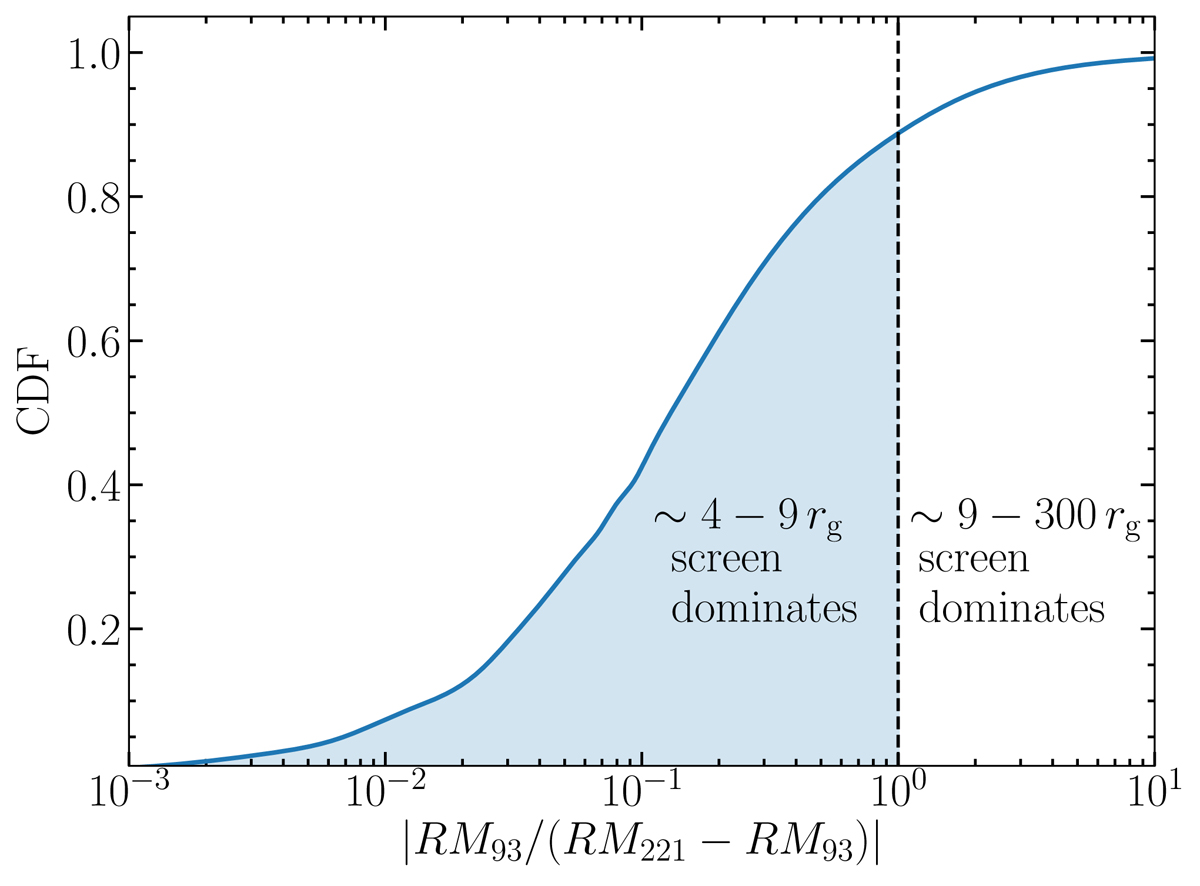
CDF of the ratio of RMs measured in the GRMHD simulation at 93 GHz (sensitive to the Faraday screen external with respect to the 93 GHz emission zone) and the difference between RM measured at 221 GHz and 93 GHz (sensitive to the screen component located between the 221 GHz and 93 GHz emission zones). Simultaneous ray-traced snapshots were considered to construct this empirical CDF. These results demonstrate that in the simulation the Faraday screen is typically (in 88% of snapshots) dominated by the contribution from the very compact region.
Current usage metrics show cumulative count of Article Views (full-text article views including HTML views, PDF and ePub downloads, according to the available data) and Abstracts Views on Vision4Press platform.
Data correspond to usage on the plateform after 2015. The current usage metrics is available 48-96 hours after online publication and is updated daily on week days.
Initial download of the metrics may take a while.