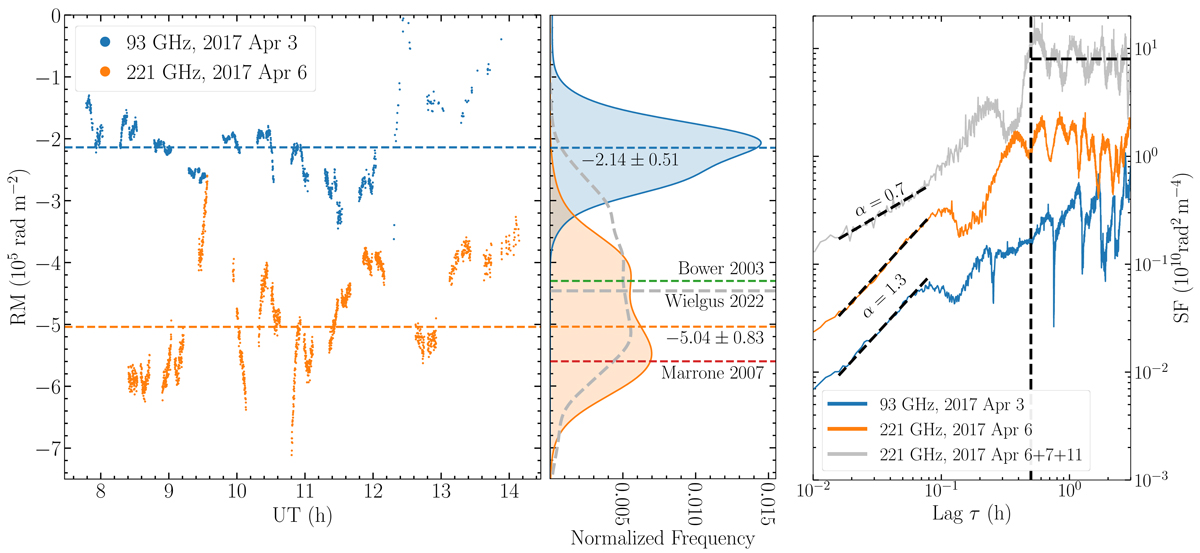
Fig. 4.
Download original image
Studies of RM in Sgr A*. Left and center: Time-resolved RM measurements in ALMA band 3 (85−101 GHz, blue) and band 6 (212−230 GHz, orange) in 2017 April, and corresponding histograms of the observed RM. The dashed lines represent mean values. The rapid variability of RM hints at the internal character of the Faraday screen, which is further supported by a significant discrepancy between the measurements obtained for the two bands, also including historical data, and a joint histogram of the 2017 April 6, 7, and 11 data (dashed gray line). Right: SF analysis of the RM variability, indicating more variability at higher frequencies, with a stronger contribution from the shortest timescales. A 0.5 h variability decorrelation timescale is found for the 221 GHz RM data, which is absent at 93 GHz.
Current usage metrics show cumulative count of Article Views (full-text article views including HTML views, PDF and ePub downloads, according to the available data) and Abstracts Views on Vision4Press platform.
Data correspond to usage on the plateform after 2015. The current usage metrics is available 48-96 hours after online publication and is updated daily on week days.
Initial download of the metrics may take a while.