Fig. 9
Download original image
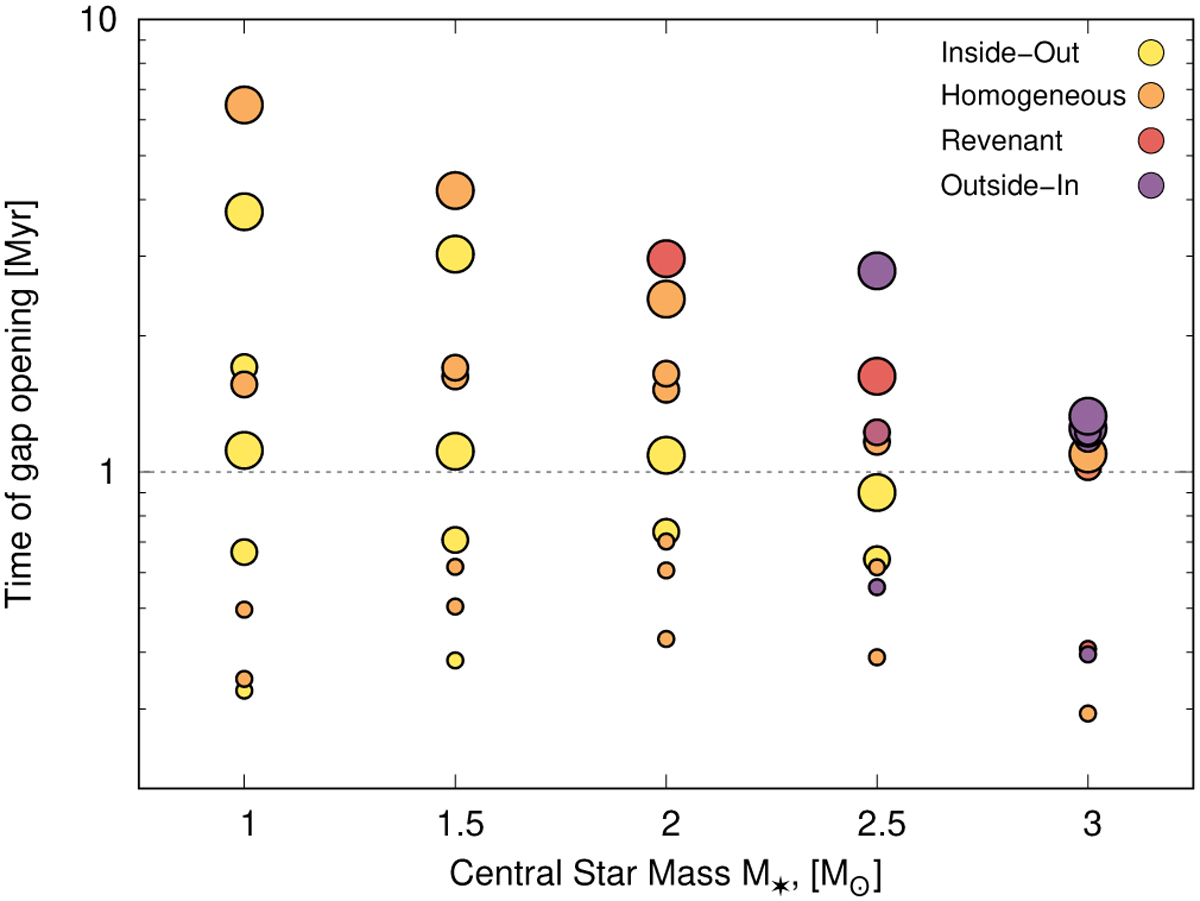
Time of the gap opening as a function of the central star mass for each of our simulations. As in Fig. 7, the colours represent the different evolutionary pathways, yellow being the classical inside-out evolution, orange the homogeneous evolution, red the revenant disc evolution, and violet the outside-in evolution. Small dots represent low-mass discs while mid-size and big dots represent intermediate and high-mass discs, respectively. As we can see here, it is mostly low-mass discs that open a gap in less than 1 Myr, stopping early the pebble flux from the outer parts.
Current usage metrics show cumulative count of Article Views (full-text article views including HTML views, PDF and ePub downloads, according to the available data) and Abstracts Views on Vision4Press platform.
Data correspond to usage on the plateform after 2015. The current usage metrics is available 48-96 hours after online publication and is updated daily on week days.
Initial download of the metrics may take a while.