Fig. 8
Download original image
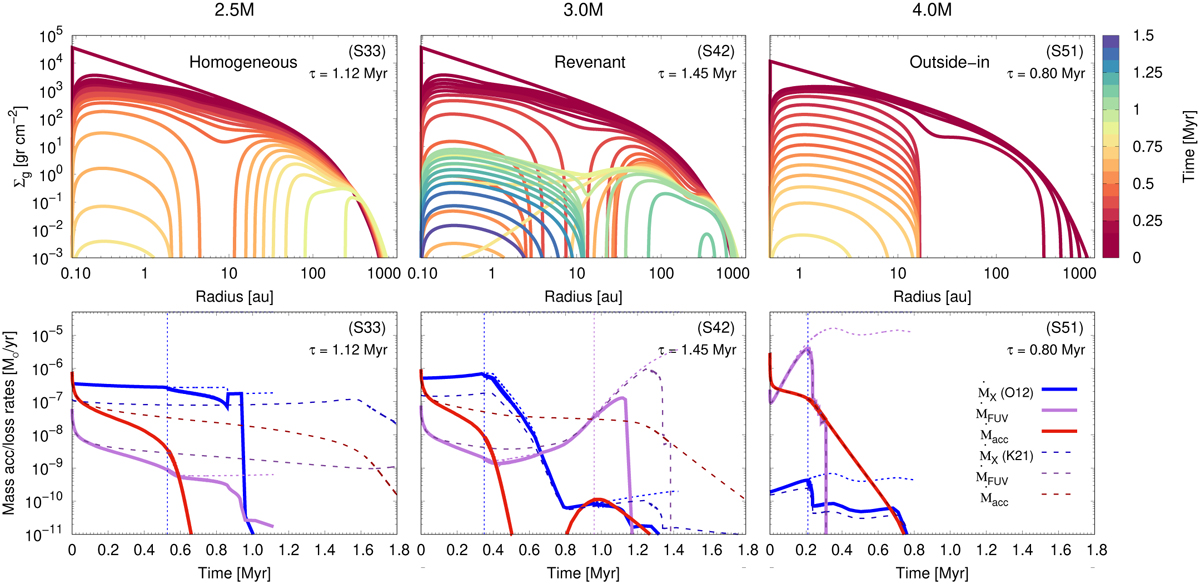
Time evolution of the gas surface density profiles (top panels) and of the mass accretion and photoevaporation mass-loss rates (bottom panels) for massive discs around stars with masses between 2.5 M⊙ (left panel), 3 M⊙ (middle panel), and 4.0 M⊙ (right panel) with α0 = 10−3. In this case, the X-ray photoevaporation rate for primordial discs has been computed by directly using Eqs. (B1)–(B3) from Appendix B in Owen et al. (2012). As in Figs. 1–3, the short dashed blue and lilac curves represent the mass-loss rates but integrated along the disc domain. For comparison we also plotted the mass accretion and photoevaporation mass-loss rates (represented by the long dashed red, blue, and lilac curves) computed by considering the X-ray photoevaporation rate for primordial discs, as in K21. Our general result seems to be a direct consequence of considering the effects of stellar evolution on disc evolution as they are apparently independent of the details of modelling X-ray photoevaporation. We still predict homogeneous, revenant, and outside-in evolution, with the only difference being that the transitions from one case to the next shift to larger stellar masses.
Current usage metrics show cumulative count of Article Views (full-text article views including HTML views, PDF and ePub downloads, according to the available data) and Abstracts Views on Vision4Press platform.
Data correspond to usage on the plateform after 2015. The current usage metrics is available 48-96 hours after online publication and is updated daily on week days.
Initial download of the metrics may take a while.