Fig. 7
Download original image
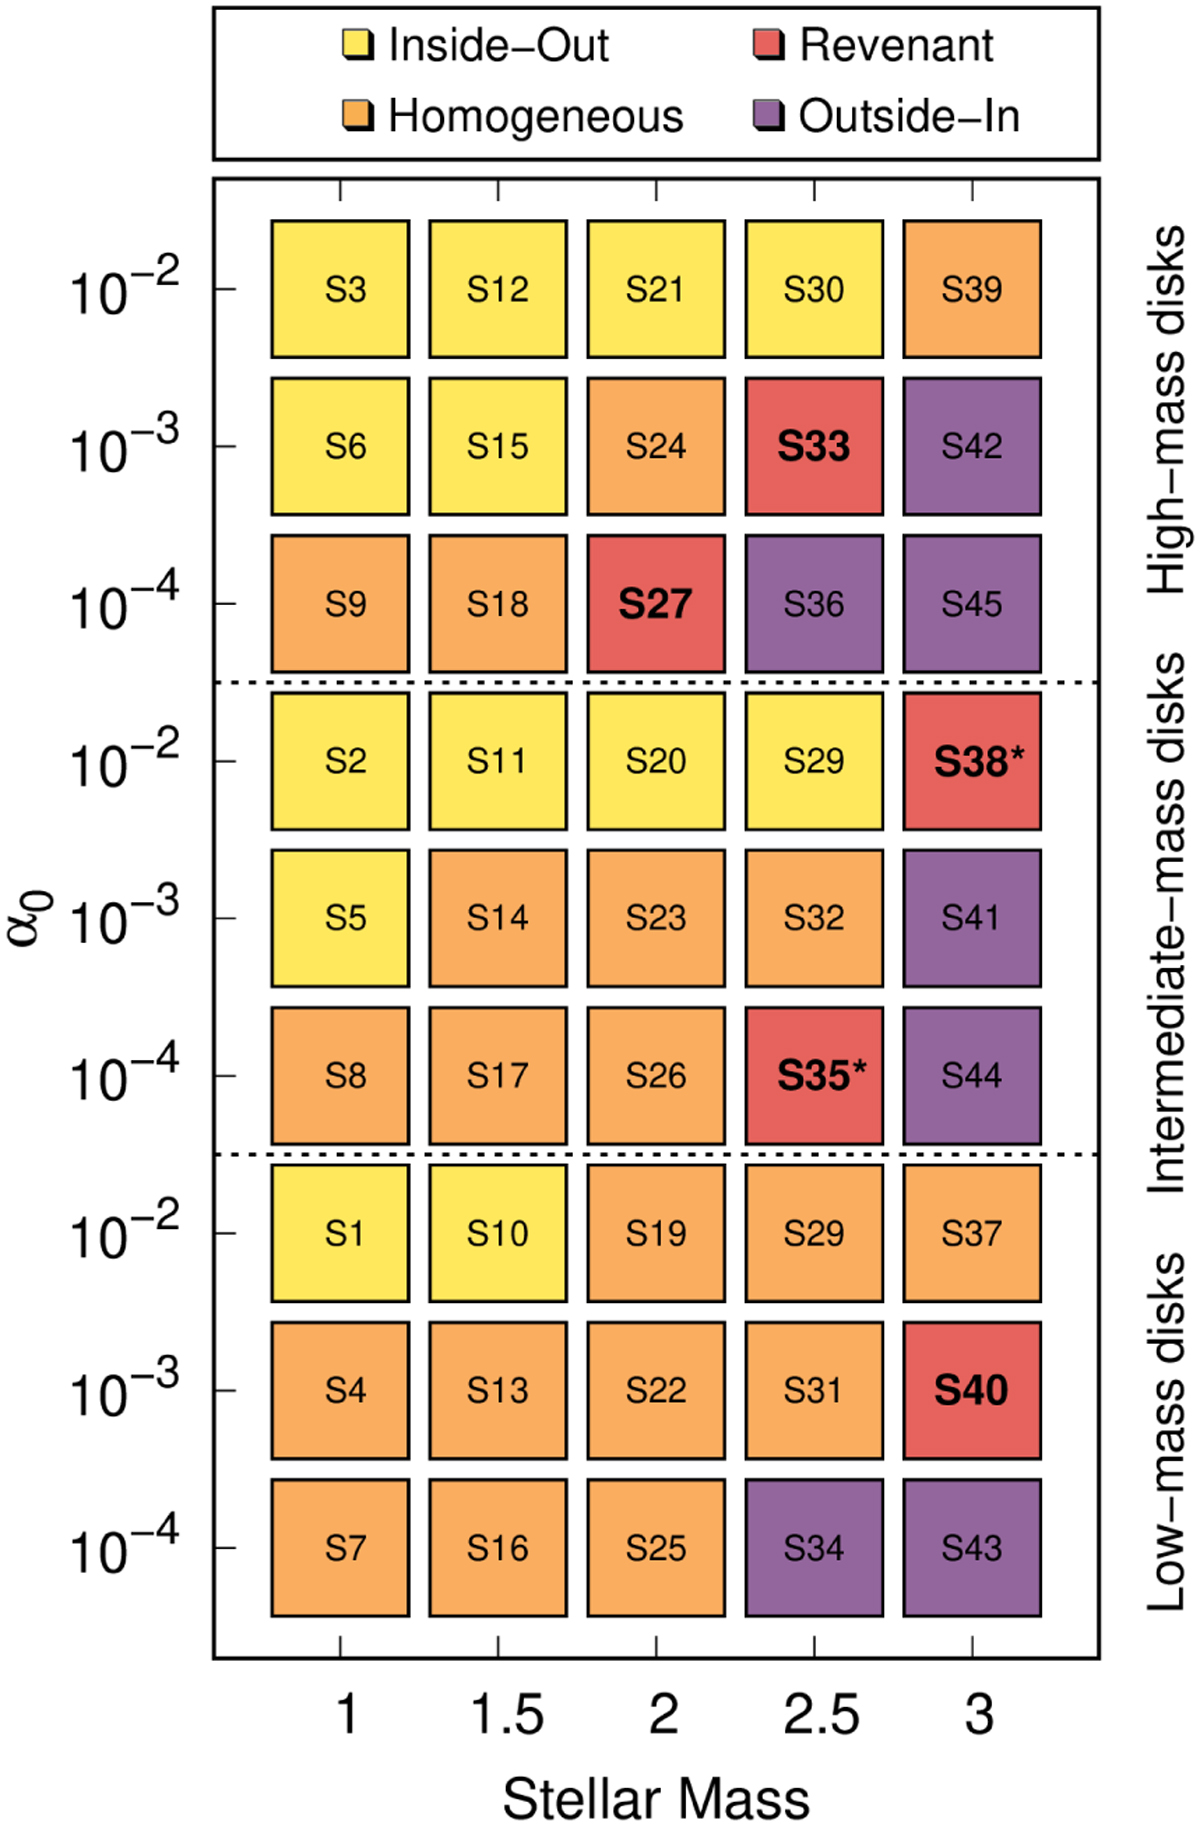
Summary of the findings described in Sect. 3.4. Each labelled square represents one of our simulations. The different colours represent the different evolutionary pathways, yellow being the classical inside-out evolution, orange the homogeneous evolution, red the revenant disc evolution (also highlighted in bold), and violet the outside-in evolution. The red cases marked with a * are those described in Sect. 3.4 that do not strictly follow the revenant disc evolution sequence. Unlike in Figs. 1–3, the simulations here are organised by disc mass, and each row represents the different α0 viscosity parameters. The transition between the different pathways can be better appreciated this way.
Current usage metrics show cumulative count of Article Views (full-text article views including HTML views, PDF and ePub downloads, according to the available data) and Abstracts Views on Vision4Press platform.
Data correspond to usage on the plateform after 2015. The current usage metrics is available 48-96 hours after online publication and is updated daily on week days.
Initial download of the metrics may take a while.