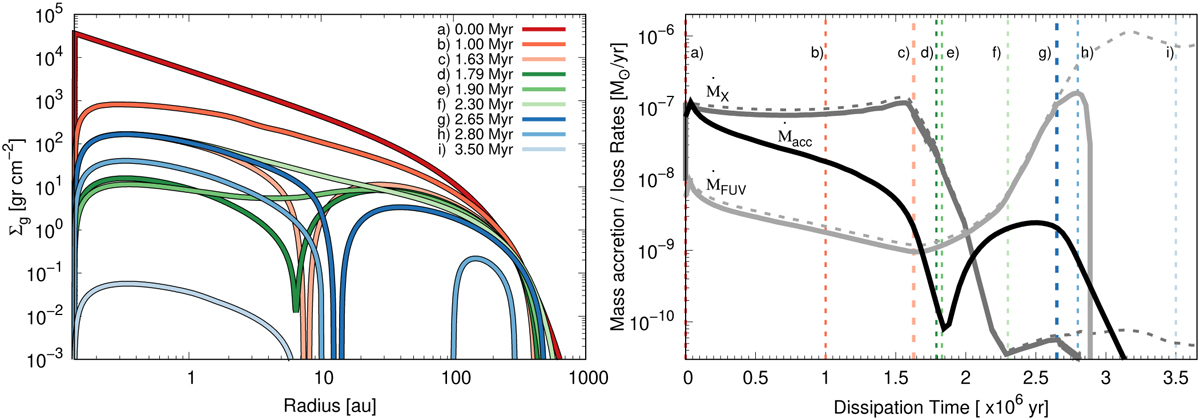
Fig. 5
Download original image
Time evolution of the gas surface density (left panel) and of the mass accretion and photoevaporation mass-loss rates (right panel) for the S33 simulation that we classify as a revenant disc. The reddish, greenish, and blueish profiles describe Stages I, II, and III, respectively, for the evolution of this kind of disc (see Sect. 3.4). The vertical dotted, coloured lines in the right panel denote the same times for the gas profiles as the left figure. In particular, the thicker lines denoted by “b” and by “g” show the positions of the first and second gap openings. It is important to note here that Ṁacc was computed at the inner border of the disc, and that ṀX and ṀFUV were integrated along the disc. Thus, at the time of the gap openings (vertical lines c and g), these curves do not represent the situation at these specific gap-opening locations. As in Figs. 1–3, the dashed curves correspond to the mass-loss rates integrated along the disc domain while the solid ones (grey and light grey) were computed considering the available mass in the disc. A movie showing the time evolution of this disc is available online.
Current usage metrics show cumulative count of Article Views (full-text article views including HTML views, PDF and ePub downloads, according to the available data) and Abstracts Views on Vision4Press platform.
Data correspond to usage on the plateform after 2015. The current usage metrics is available 48-96 hours after online publication and is updated daily on week days.
Initial download of the metrics may take a while.