Fig. 4
Download original image
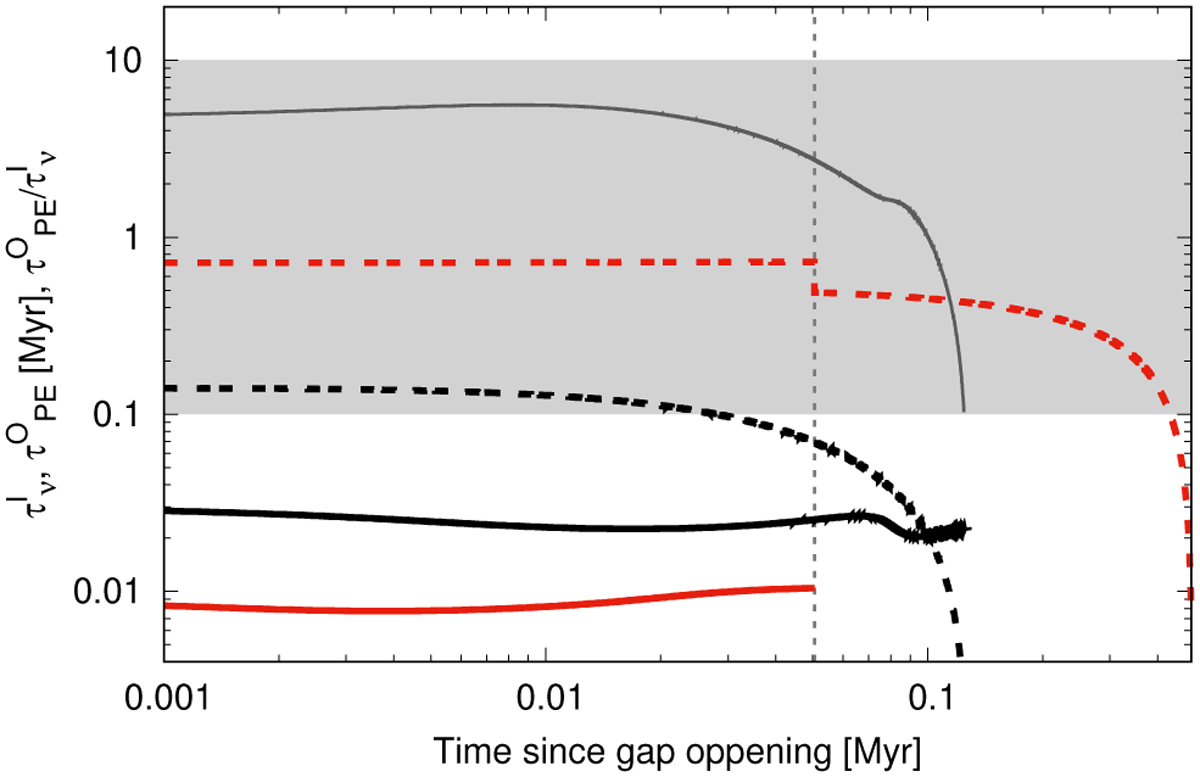
Viscous (![]() , solid lines) and photoevaporation (
, solid lines) and photoevaporation (![]() , dashed lines) timescales from the time of gap opening for the discs labelled S3 (red lines) and S39 (black lines). The solid dark grey curve represents the ratio
, dashed lines) timescales from the time of gap opening for the discs labelled S3 (red lines) and S39 (black lines). The solid dark grey curve represents the ratio ![]() , for the S39 disc that evolves always bounded within the shaded grey area, between 0.1 and 10. The same ratio for S3 falls completely outside the range of this figure. As a consequence and following our definition for homogeneous evolution, while model S39 describes the homogeneous disc evolution around a 3 M⊙ star (black lines), and S3 represents inside-out evolution (red lines) of a disc around a star of 1 M⊙. The abrupt decrease in
, for the S39 disc that evolves always bounded within the shaded grey area, between 0.1 and 10. The same ratio for S3 falls completely outside the range of this figure. As a consequence and following our definition for homogeneous evolution, while model S39 describes the homogeneous disc evolution around a 3 M⊙ star (black lines), and S3 represents inside-out evolution (red lines) of a disc around a star of 1 M⊙. The abrupt decrease in ![]() exactly at the time the disc becomes a transition disc (vertical dashed grey line) is due to the change to the direct X-ray photoevaporation rate regime in S3.
exactly at the time the disc becomes a transition disc (vertical dashed grey line) is due to the change to the direct X-ray photoevaporation rate regime in S3.
Current usage metrics show cumulative count of Article Views (full-text article views including HTML views, PDF and ePub downloads, according to the available data) and Abstracts Views on Vision4Press platform.
Data correspond to usage on the plateform after 2015. The current usage metrics is available 48-96 hours after online publication and is updated daily on week days.
Initial download of the metrics may take a while.