Fig. A.1
Download original image
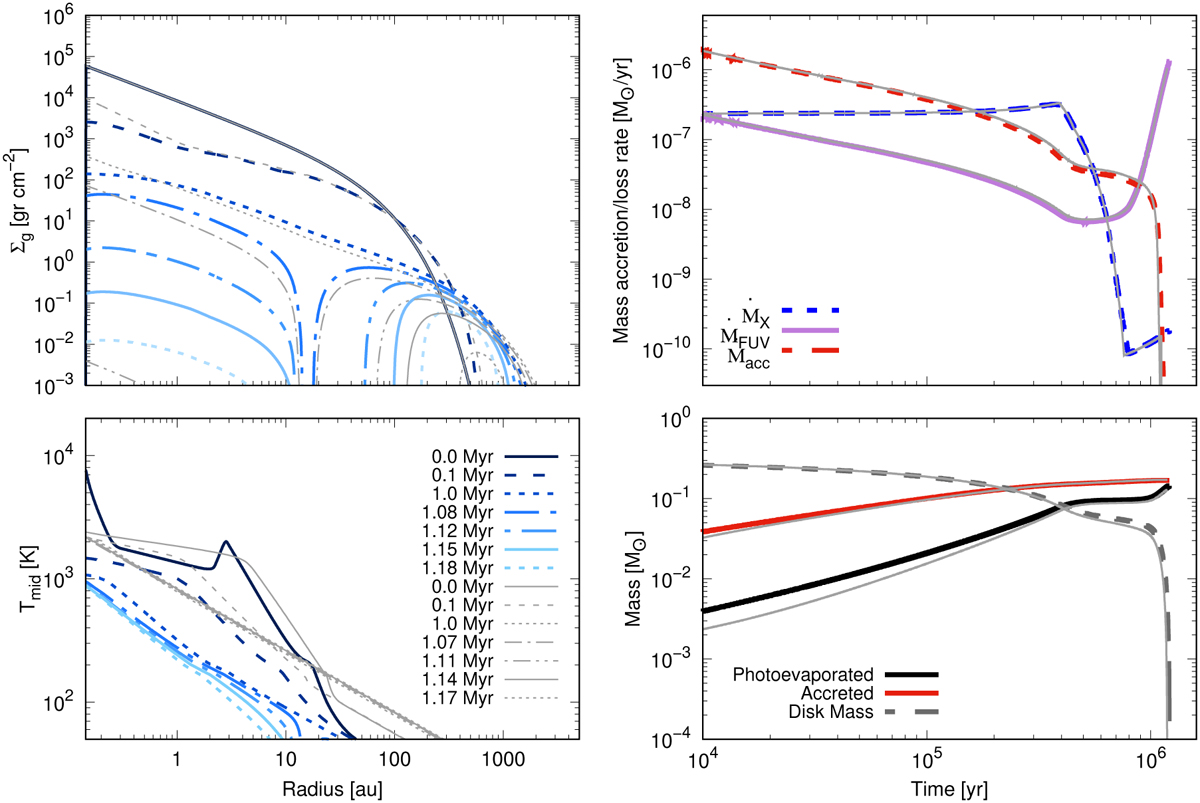
Time evolution of a disc around a 3M⊙ star computed with this paper version of PLANETALP. As in fig. 8 of Kunitomo et al. (2021), the panels on the left show the time evolution of the gas surface density (top) and the midplane temperature (bottom) profiles. The panels on the right show the time evolution of the mass accretion rate, Ṁacc, and the mass-loss rates by X-ray and FUV photoevaporation (top), and the evolution of the disc mass and the time-integrated masses of accretion and photoevaporation (FUV and X-ray). The thick grey curves in each panel show the results from K21
Current usage metrics show cumulative count of Article Views (full-text article views including HTML views, PDF and ePub downloads, according to the available data) and Abstracts Views on Vision4Press platform.
Data correspond to usage on the plateform after 2015. The current usage metrics is available 48-96 hours after online publication and is updated daily on week days.
Initial download of the metrics may take a while.