Fig. 1
Download original image
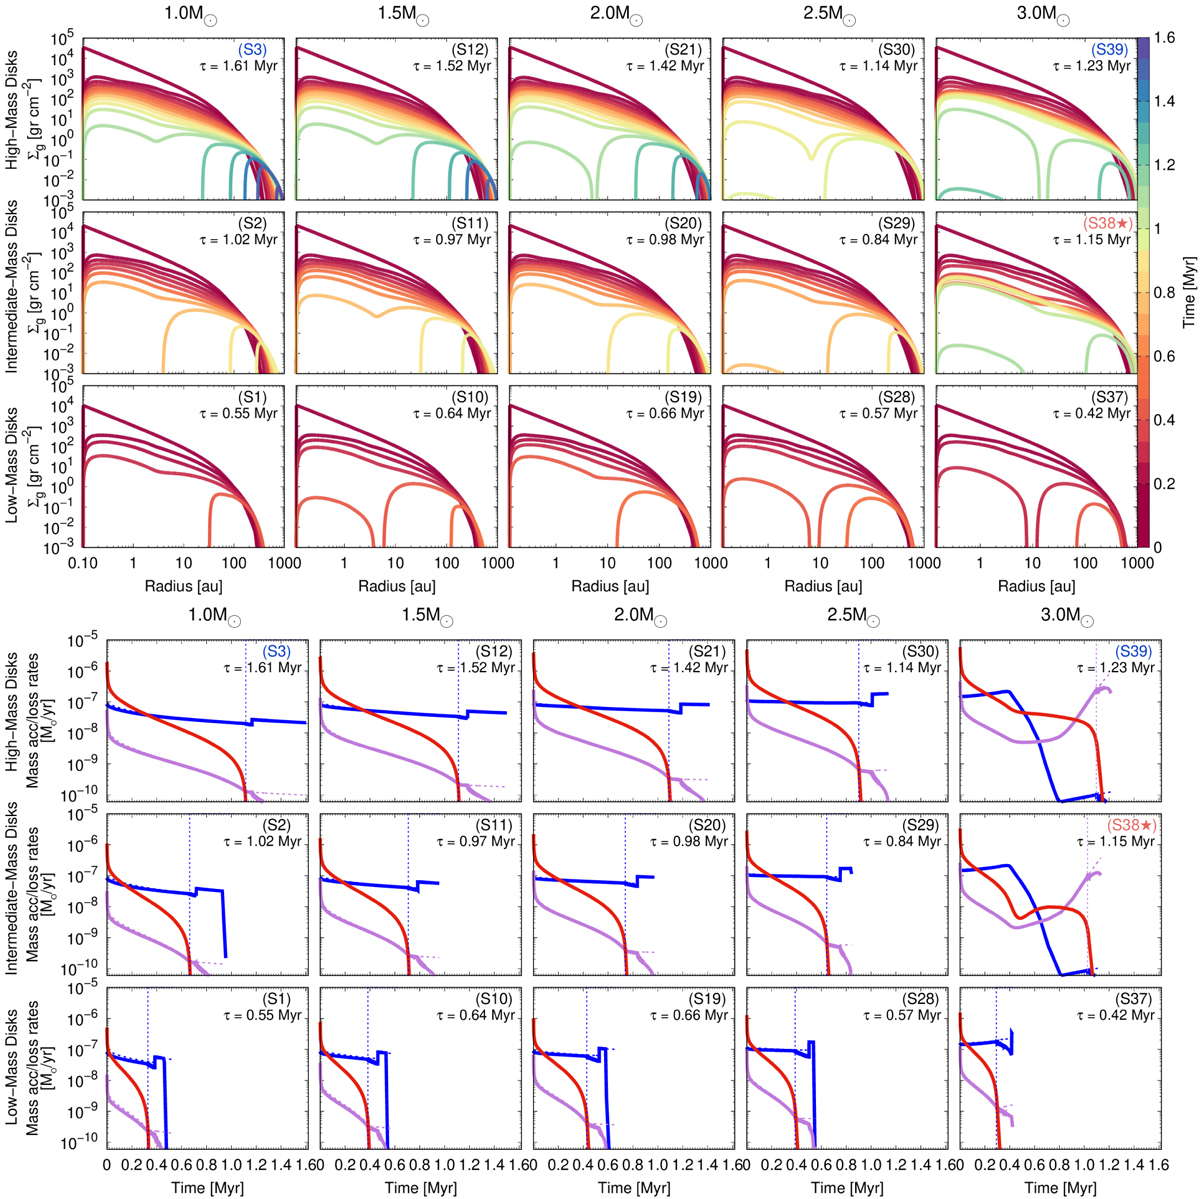
Upper panels: time evolution of the gas surface density profiles for massive (top), intermediate (middle), and low (bottom) mass discs around stars with masses between 1 M⊙ and 3 M⊙ in discs with α0 = 10−2, plotted every 0.1 Myr. The labels at the top right of each panel represent the simulation number and the dissipation timescale, also represented by the colour scale bar shown on the vertical right-hand side of the plot. The coloured simulation numbers refer to specific cases described in the text. Lower panels: time evolution of the mass accretion rate Ṁacc (solid red curve) and the mass-loss rates ṀX (solid blue curve) and ṀFUV (solid lilac curve) by the X-ray and FUV photoevaporation, respectively, for the same discs, integrated along the regions where there is still gas surface density to remove. The dashed blue and lilac curves represent the same mass-loss rates but integrated along the disc domain. The vertical dashed lines represent the time at which the gap opened in the disc, due to the effects of either X-ray (blue) or FUV (lilac) photoevaporation. For the high viscosity parameter assumed here, most discs evolve following the classical inside-out disc dispersal (see Sect. 3.1). Only for the highest stellar and disc masses (see cases S38 and S39) do the outer and inner discs disappear on similar timescales (a pathway that we call homogeneous disc evolution).
Current usage metrics show cumulative count of Article Views (full-text article views including HTML views, PDF and ePub downloads, according to the available data) and Abstracts Views on Vision4Press platform.
Data correspond to usage on the plateform after 2015. The current usage metrics is available 48-96 hours after online publication and is updated daily on week days.
Initial download of the metrics may take a while.