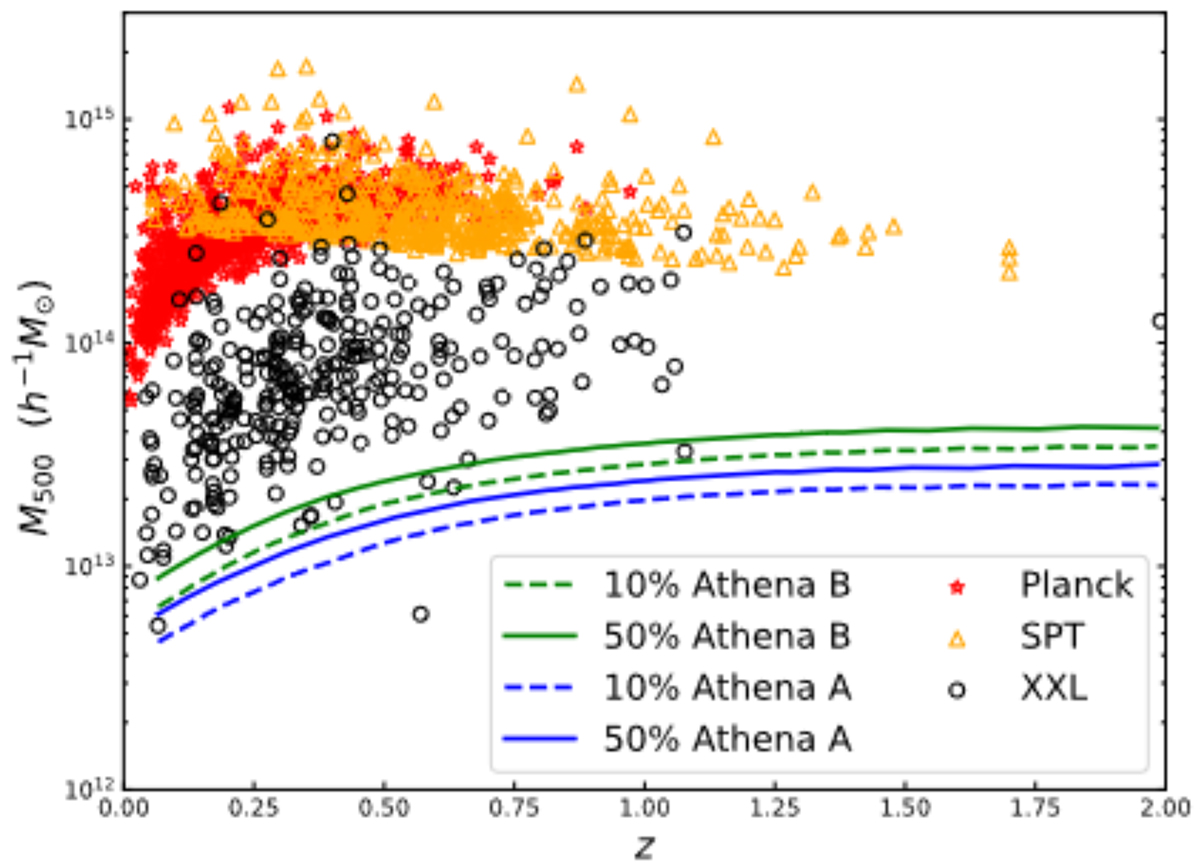
Fig. 2.
Download original image
Mass detection limit for surveys A and B. The plain (dashed) lines represent the 50% (10%) detection limit in the M500c − z plane. A given cluster with mass above (below) a line has a detection probability of higher (lower) than 50% in the corresponding survey design. The circles, stars, and triangles denote cluster samples from XXL (Adami et al. 2018), Planck SZ (Planck Collaboration XXVII 2016), and SPT (Bleem et al. 2015), respectively.
Current usage metrics show cumulative count of Article Views (full-text article views including HTML views, PDF and ePub downloads, according to the available data) and Abstracts Views on Vision4Press platform.
Data correspond to usage on the plateform after 2015. The current usage metrics is available 48-96 hours after online publication and is updated daily on week days.
Initial download of the metrics may take a while.