Fig. 3
Download original image
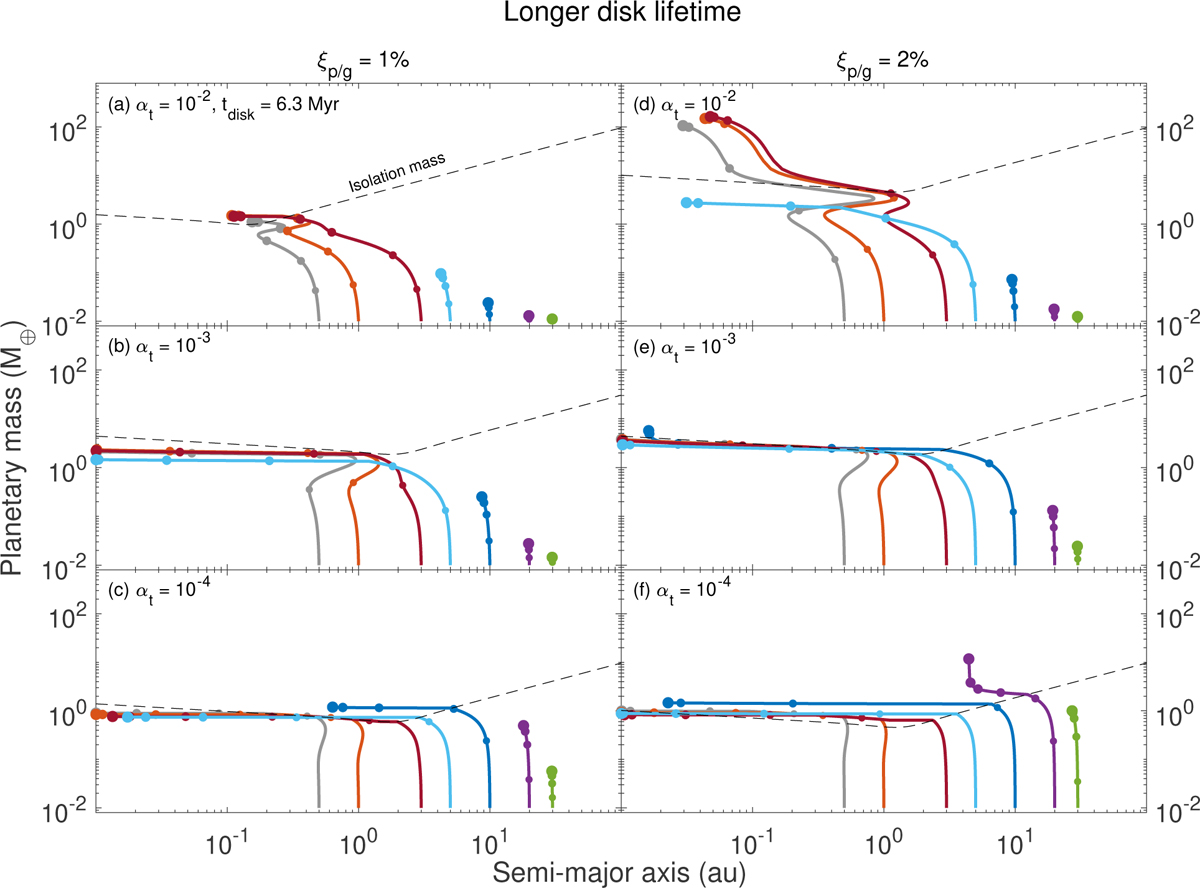
Growth and migration of single protoplanets in disks of a long lifetime at different turbulent levels and pebble-to-gas mass flux ratios around stars of M★ = 0.1 M⊙. Three turbulent coefficients of αt = 10−2 (upper), 10−3 (middle) and 10−4 (lower) and two pebble-to-gas flux ratios of ξp/g = 1% (left) and 2% (right) are shown. The planet and disk parameters are listed in Table 1. The dashed line represents the pebble isolation mass at the time when the planet born at 1 au reaches this value. The increasing sizes of the dots denote the disk evolution at one Myr intervals. Compared to Fig. 2, more massive planets from in disk with a longer lifetime.
Current usage metrics show cumulative count of Article Views (full-text article views including HTML views, PDF and ePub downloads, according to the available data) and Abstracts Views on Vision4Press platform.
Data correspond to usage on the plateform after 2015. The current usage metrics is available 48-96 hours after online publication and is updated daily on week days.
Initial download of the metrics may take a while.