Fig. 9.
Download original image
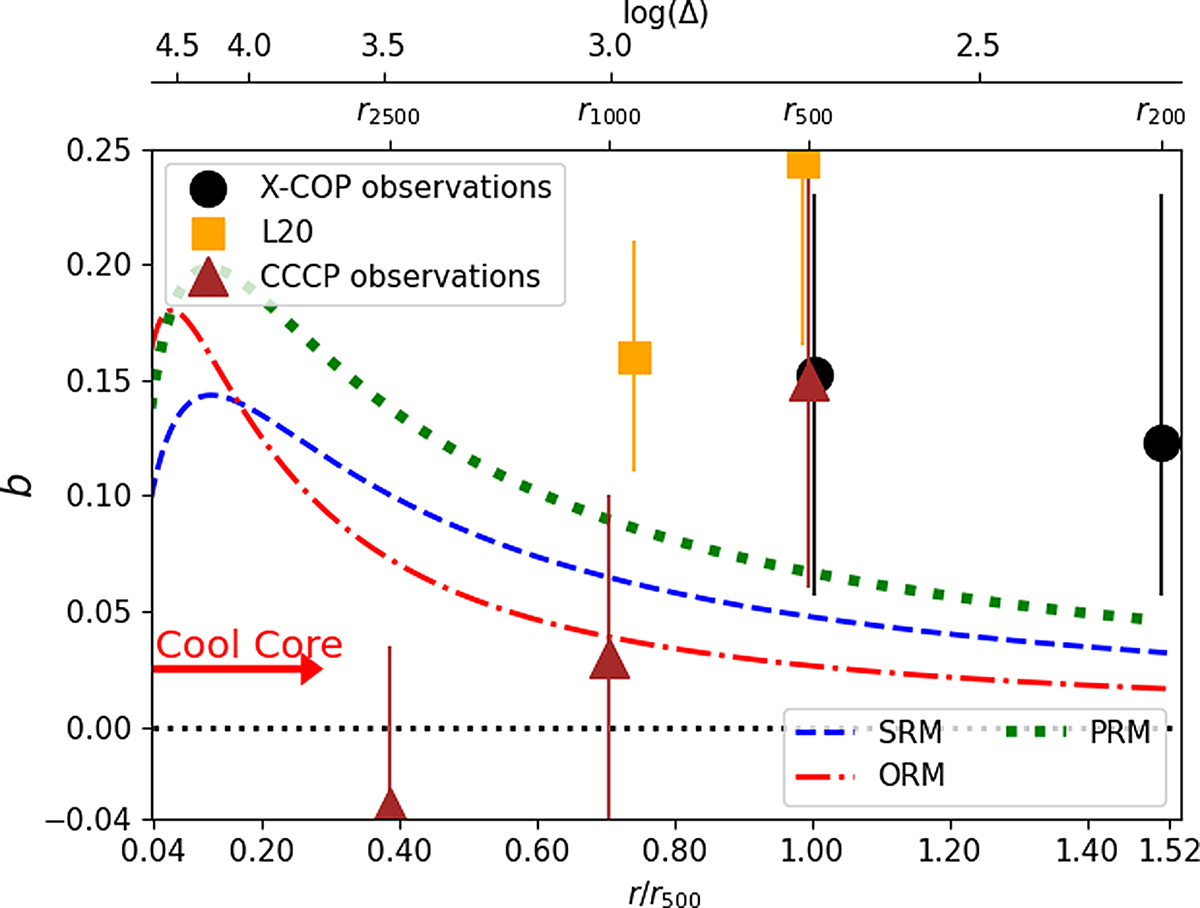
Profiles of the hydrostatic mass bias of the SRM (blue dashed line), ORM (red dash-dotted line) and PRM (green dotted line) models, compared to the observational measurements (points): in particular, to average hydrostatic mass biases, taken from Fig. 5 of Ettori et al. (2019, black points), from Tables 2 and 4 of Lovisari et al. (2020, orange points), and from Table 4 of Mahdavi et al. (2013, brown points). The vertical error bars of observational data indicate 1σ uncertainty for b. In the bottom axis, the radius is normalized to r500 of the corresponding model, with the SRM model radii, r2500, r1000, r500, and r200, reported on the plot top. The top axis reports the corresponding overdensity, Δ, of the SRM model (for the ORM and PRM models the overdensity values are very similar to those of the SRM model). The radius corresponding to a given overdensity was computed from the true mass profile, which, in the case of observational data, was assumed to be obtained from the weak gravitational lensing analysis. The red arrow indicates the extent of the cool core.
Current usage metrics show cumulative count of Article Views (full-text article views including HTML views, PDF and ePub downloads, according to the available data) and Abstracts Views on Vision4Press platform.
Data correspond to usage on the plateform after 2015. The current usage metrics is available 48-96 hours after online publication and is updated daily on week days.
Initial download of the metrics may take a while.