Fig. 4.
Download original image
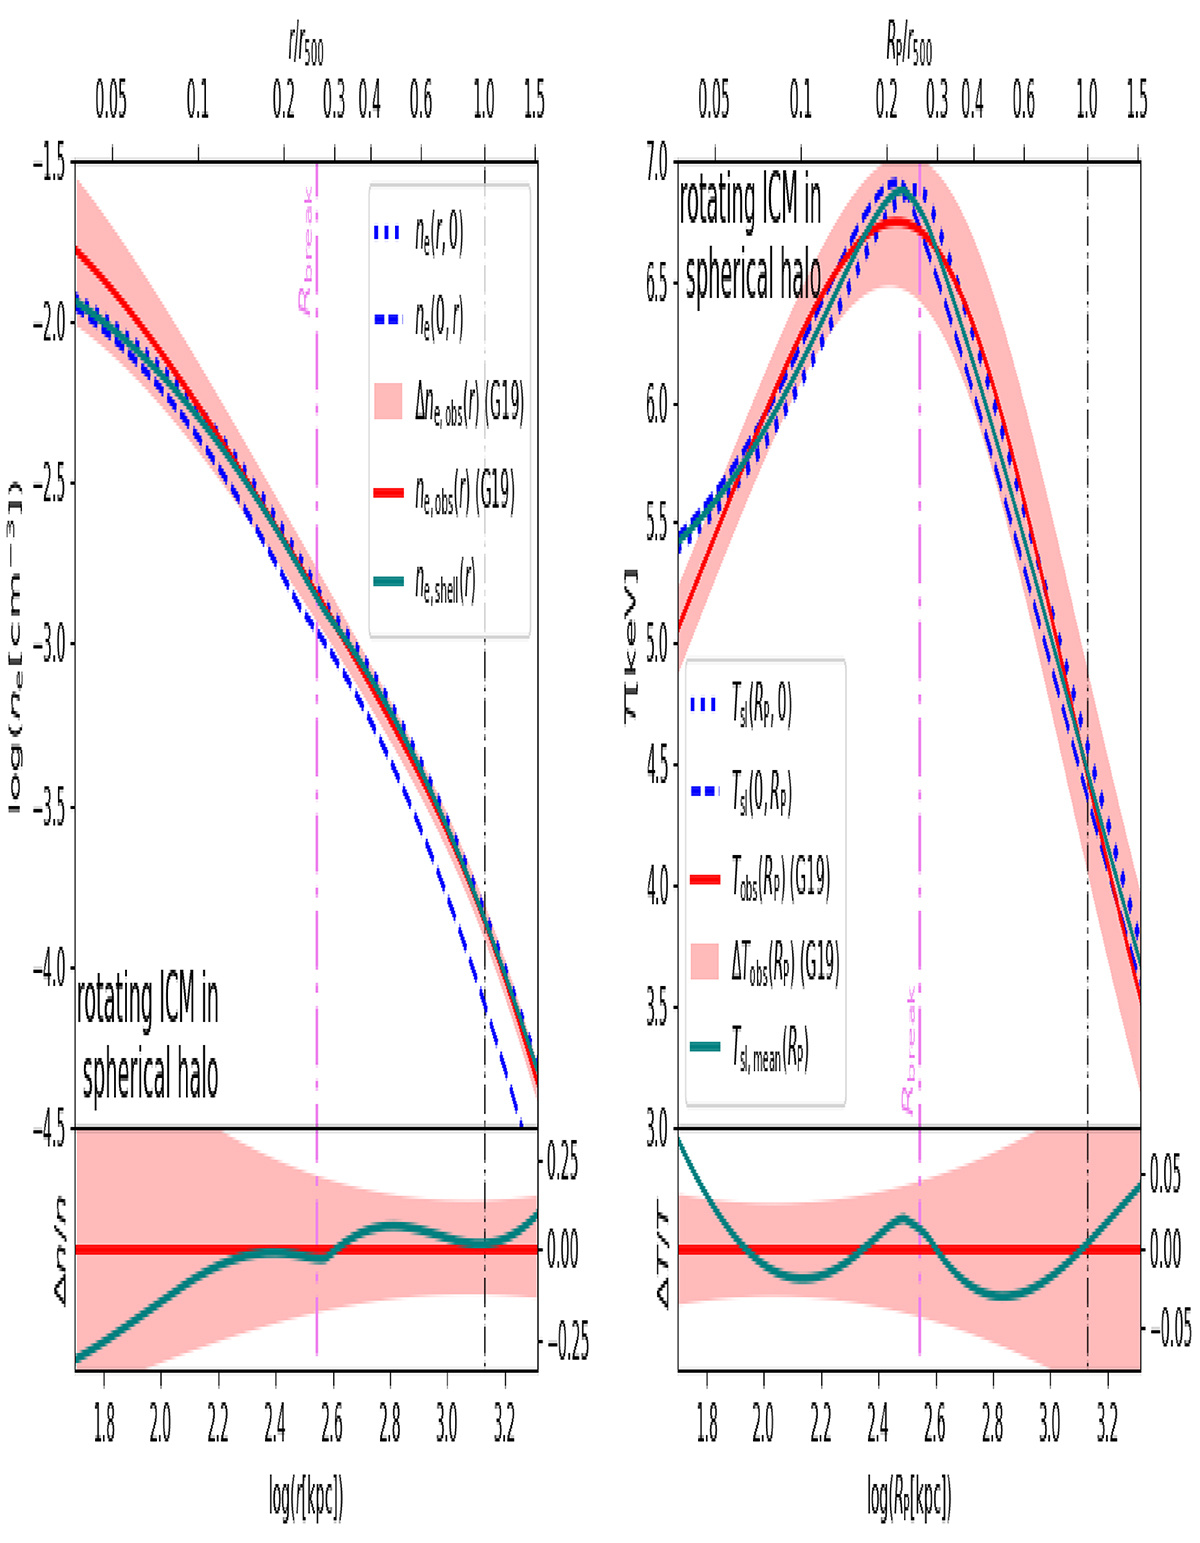
Thermodynamic profiles of the ICM in the SRM model. Upper panels: radial (dotted) and vertical (dashed) profiles of electron number density (left panel) and spectroscopic-like temperature (right panel) for the SRM model (blue lines) compared with the corresponding average observed profiles (solid red lines) and their scatter (shaded red band), taken from Ghirardini et al. (2019a, G19 in the legends). Here, ne, shell (solid green line; left panel) is the angle-averaged (see Sect. 2.2) density profile of the SRM model, and Tsl, mean(RP) = [Tsl(RP,0)+Tsl(0,RP)]/2 (solid green line; right panel) is its average spectroscopic-like temperature profile. Lower panels: departure of average profile (solid green lines; see above) of density (left panel) and spectroscopic-like temperature (right panel) of the SRM model from the average observed profiles (solid red lines) with their scatter (shaded red band). The spherical radius, r, and the radius in the plane of the sky, ![]() , are given in kpc in the bottom axis and normalized to r500 ≃ 1345 kpc in the top axis. The vertical, dash-dotted violet and black lines indicate Rbreak and r500, respectively. The virial temperature of this model, defined as in Eq. (59) of Voit (2005), is T200 ≃ 6.46 keV.
, are given in kpc in the bottom axis and normalized to r500 ≃ 1345 kpc in the top axis. The vertical, dash-dotted violet and black lines indicate Rbreak and r500, respectively. The virial temperature of this model, defined as in Eq. (59) of Voit (2005), is T200 ≃ 6.46 keV.
Current usage metrics show cumulative count of Article Views (full-text article views including HTML views, PDF and ePub downloads, according to the available data) and Abstracts Views on Vision4Press platform.
Data correspond to usage on the plateform after 2015. The current usage metrics is available 48-96 hours after online publication and is updated daily on week days.
Initial download of the metrics may take a while.