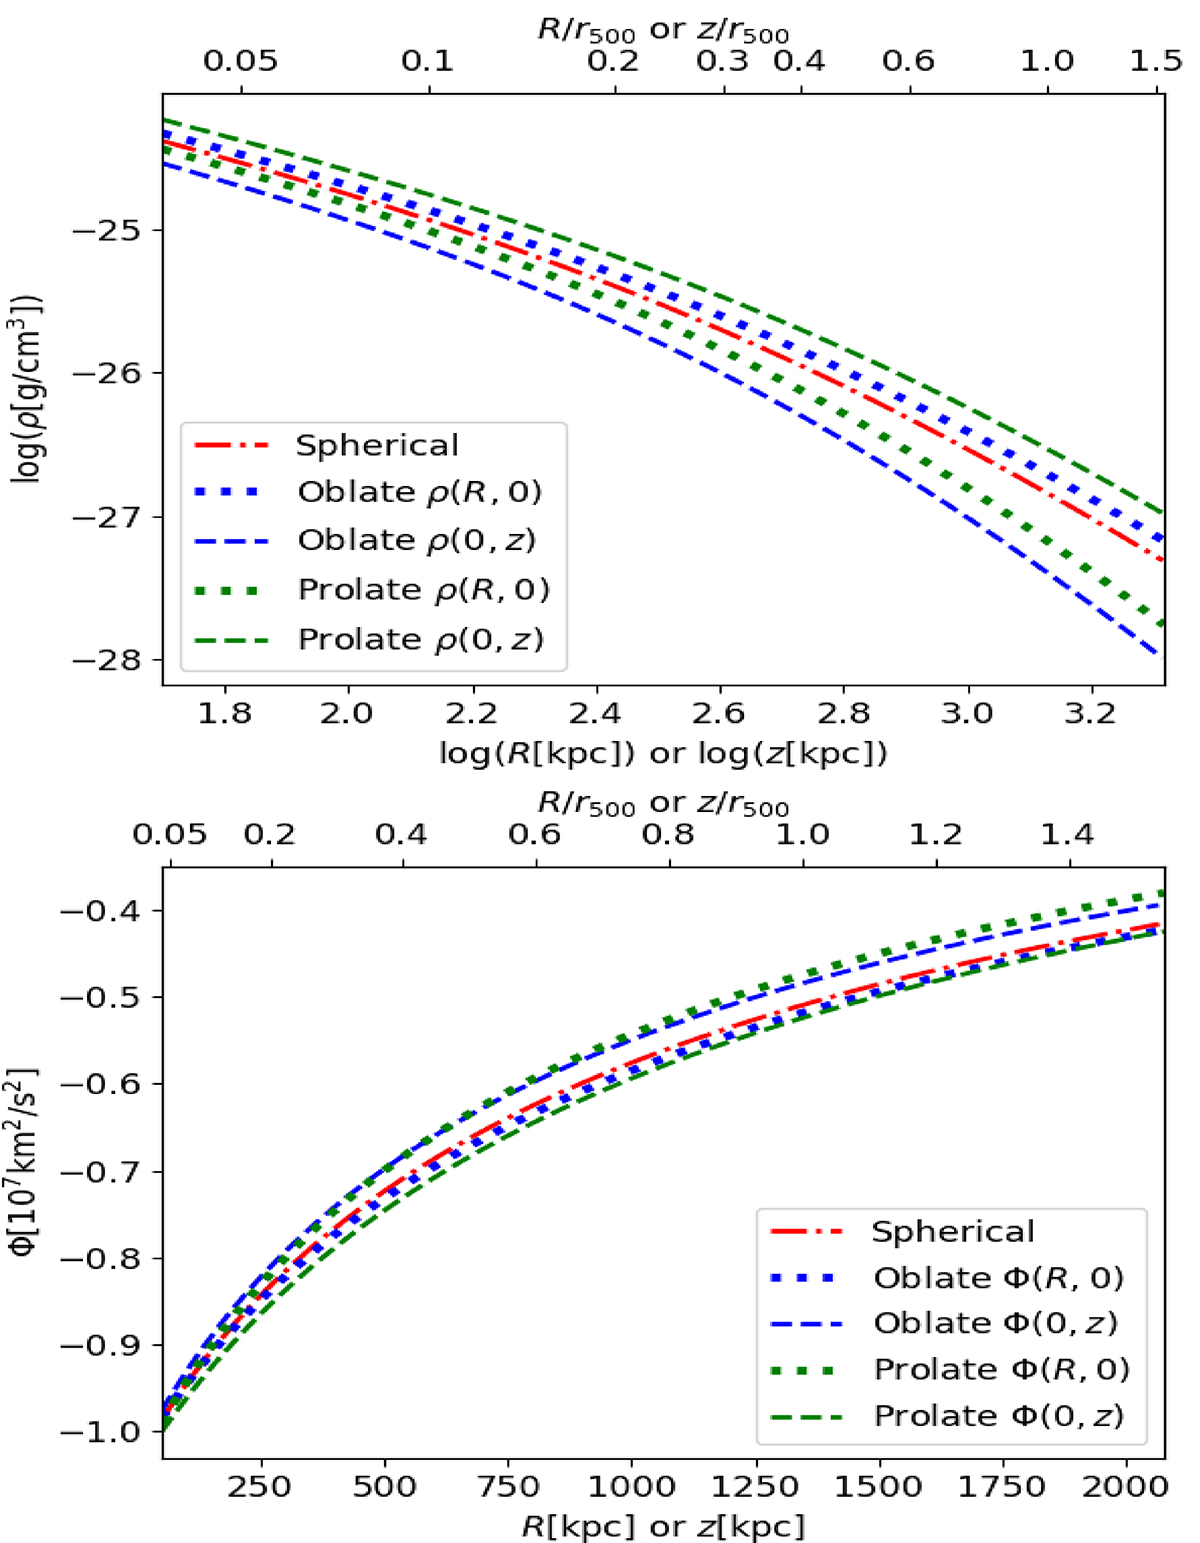
Fig. 2.
Download original image
Profiles of density (upper panel) and gravitational potential (lower panel) of SDM (red lines), ODM (blue lines), and PDM (green lines) halo models (see Table 1). In particular, for our axisymmetric models we plot the density and gravitational potential profiles along the symmetry axis (dashed lines) and in the equatorial plane (dotted lines). The top axis in both panels indicates the distance from the center, normalized to r500 of the SDM halo model (r500 = 1345 kpc; we note that the values of r500 in our three halo models differ by less than 2%).
Current usage metrics show cumulative count of Article Views (full-text article views including HTML views, PDF and ePub downloads, according to the available data) and Abstracts Views on Vision4Press platform.
Data correspond to usage on the plateform after 2015. The current usage metrics is available 48-96 hours after online publication and is updated daily on week days.
Initial download of the metrics may take a while.