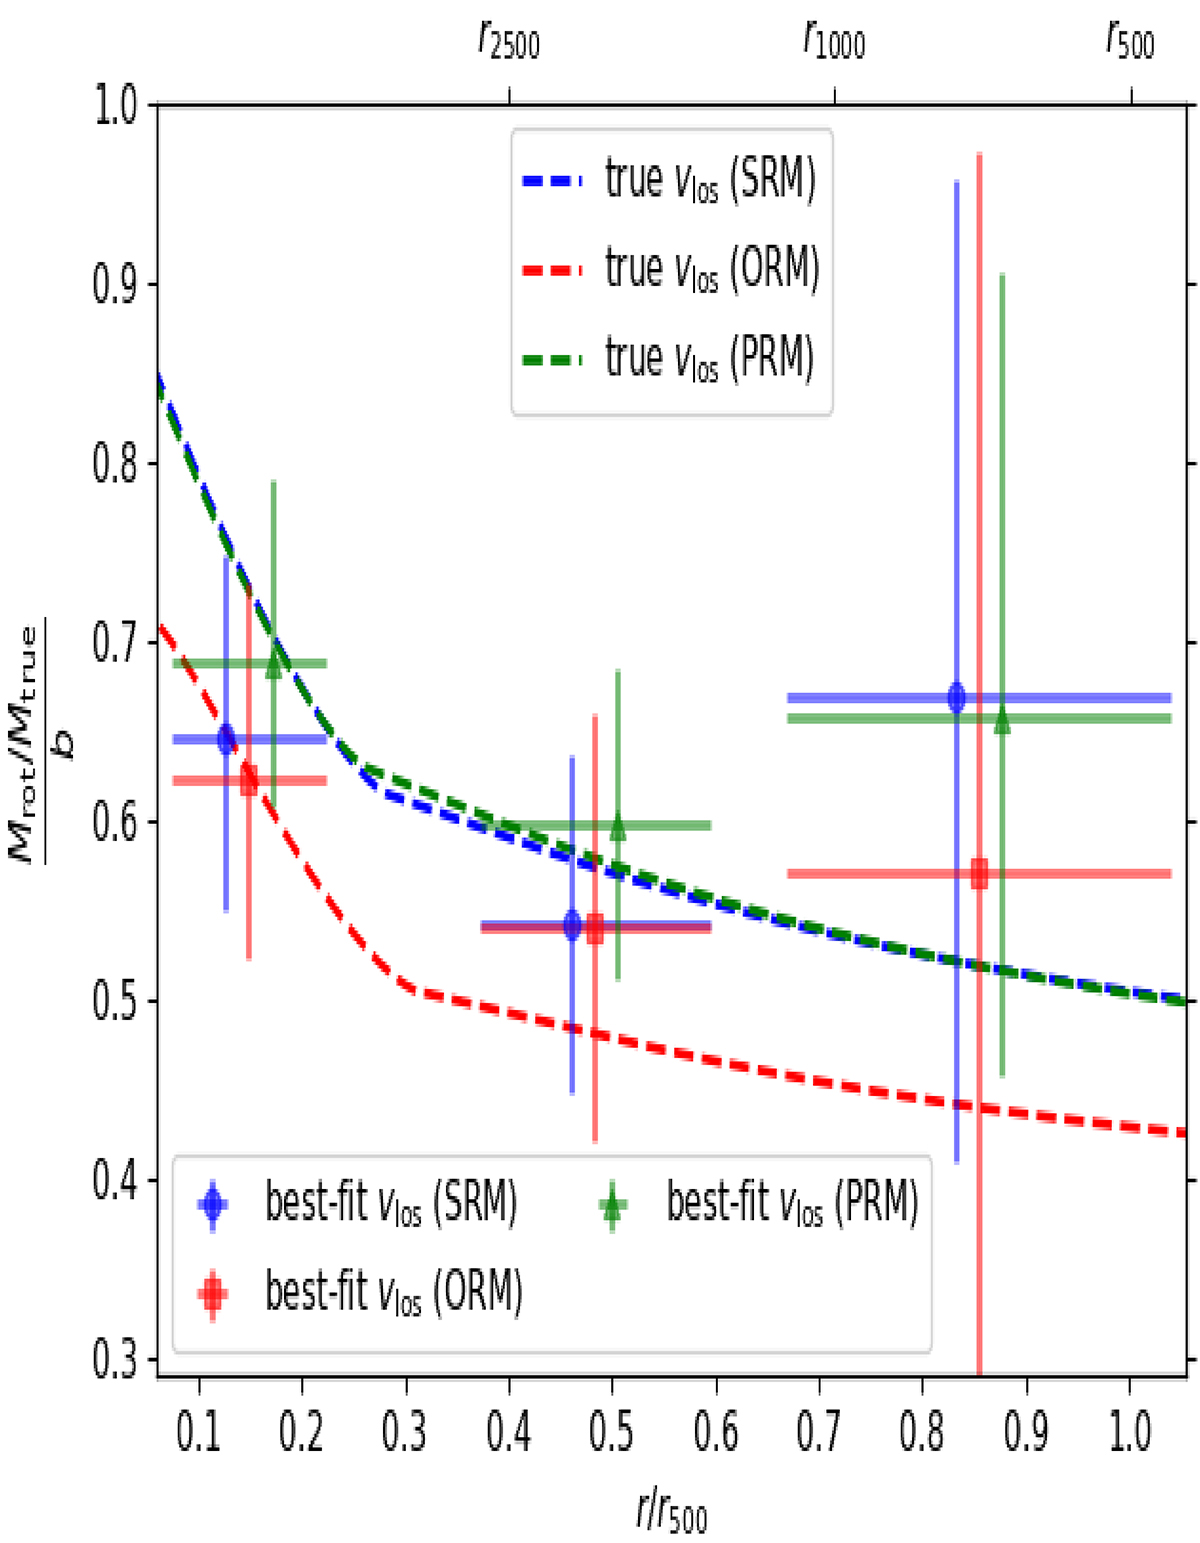
Fig. 11.
Download original image
Fraction of the hydrostatic mass bias due to rotation (b) of the SRM (blue), ORM (red), and PRM (green) models, which we recovered from the true (dashed lines) and best-fit (points) LOS velocities using Eq. (33). The horizontal error bars indicate the extent of the region of the mock observations, while the vertical error bars indicate the 1σ errors on Mrot estimated from X-ray spectroscopy. The radius was normalized to r500 as in Fig. 9, with the SRM radii, r2500, r1000, and r500, indicated in the top axis.
Current usage metrics show cumulative count of Article Views (full-text article views including HTML views, PDF and ePub downloads, according to the available data) and Abstracts Views on Vision4Press platform.
Data correspond to usage on the plateform after 2015. The current usage metrics is available 48-96 hours after online publication and is updated daily on week days.
Initial download of the metrics may take a while.