Fig. 10.

Download original image
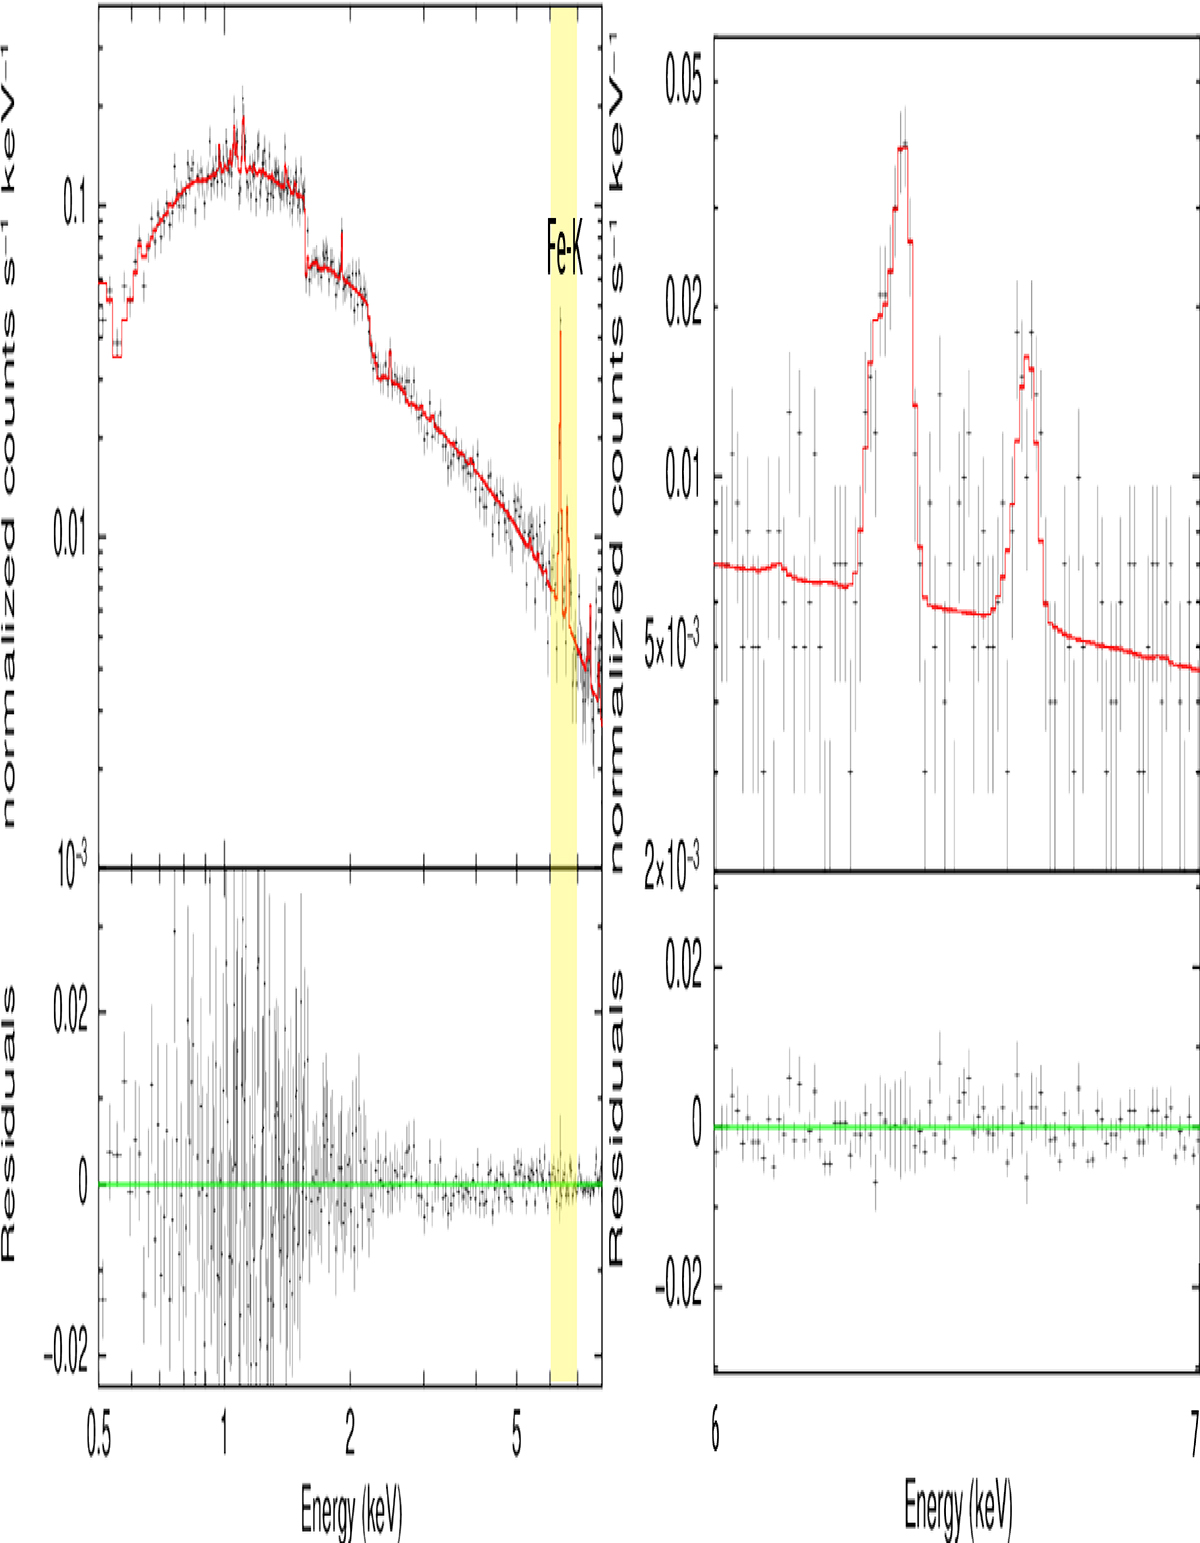
Representative spectrum of the ICM in equilibrium in our cluster models. Left panel: fit (upper panel; red line) and residuals (lower panel) to the mock spectrum of the receding ICM (black crosses), in equilibrium in the SRM model, for the plane-of-the-sky region R1, taking σturb = 500 km s−1. FeXXV and FeXXVI (with rest-frame energies close to 6.7 and 6.9 keV, respectively), referred to as Fe–K, are the prominent emission lines in the upper panel. In the lower panel, the green line traces the null residuals. We rebinned the data for display purposes (we recall that, using the C-Statistics, the data without backgrounds are not binned). Right panel: zoom on the range 6 − 7 keV of the yellow band in the left panel, where the emission lines FeXXV and FeXXVI are emphasized. Here, we rebinned the data in a different way from the left panel for display purposes.
Current usage metrics show cumulative count of Article Views (full-text article views including HTML views, PDF and ePub downloads, according to the available data) and Abstracts Views on Vision4Press platform.
Data correspond to usage on the plateform after 2015. The current usage metrics is available 48-96 hours after online publication and is updated daily on week days.
Initial download of the metrics may take a while.


