Open Access
Fig. 5
Download original image
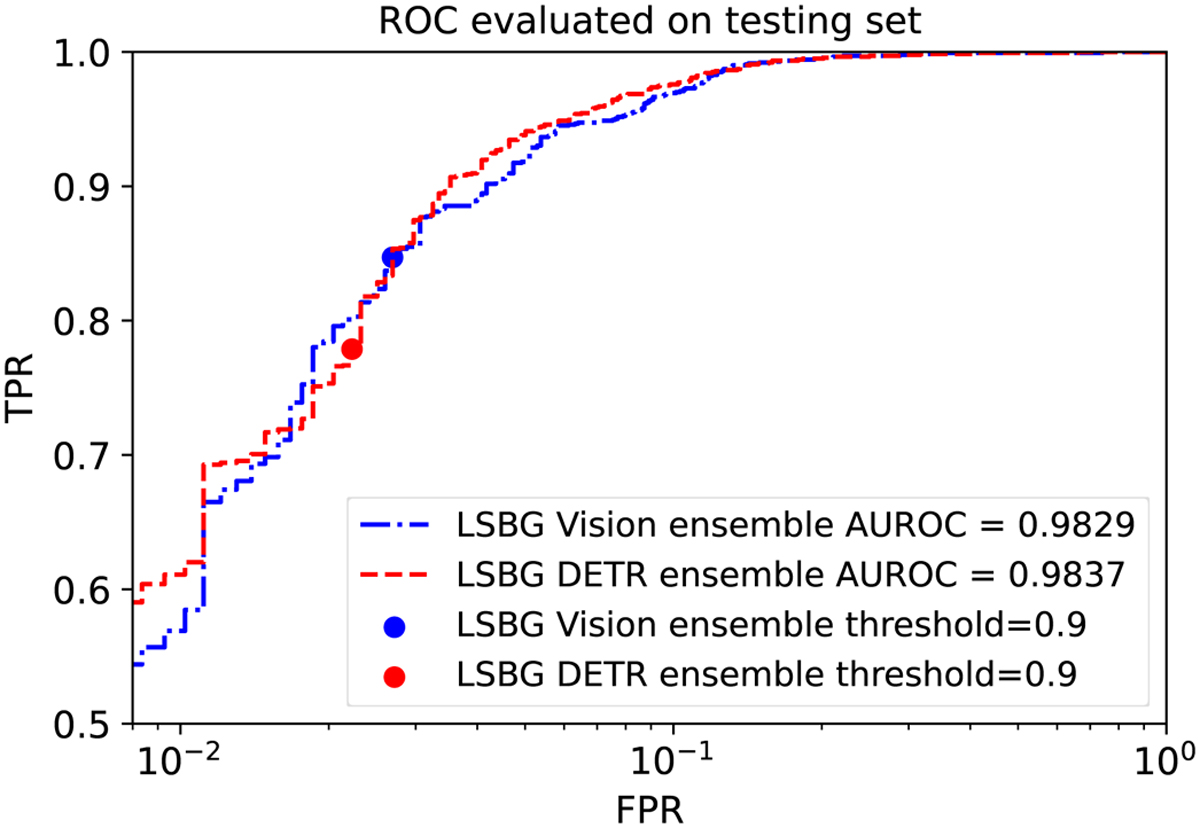
Receiver operating characteristic curve of the ensemble models. The red and blue lines represent the variation of FPR and TPR as a function of the threshold for LSBG DETR and LSBG Vision ensembles, respectively. The red and blue points mark the TPR and FPR for a threshold = 0.9.
Current usage metrics show cumulative count of Article Views (full-text article views including HTML views, PDF and ePub downloads, according to the available data) and Abstracts Views on Vision4Press platform.
Data correspond to usage on the plateform after 2015. The current usage metrics is available 48-96 hours after online publication and is updated daily on week days.
Initial download of the metrics may take a while.