Fig. 24
Download original image
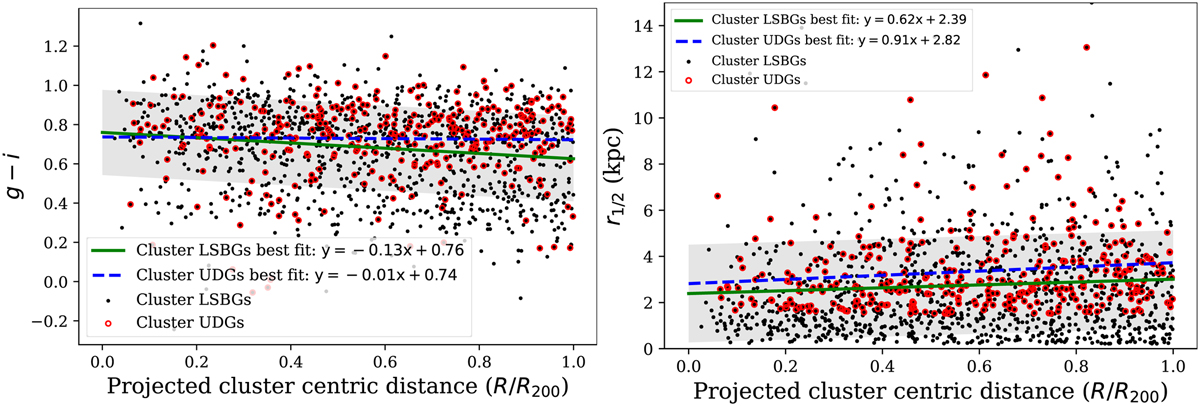
g – i colour of the cluster LSBGs (black points) and r1/2 as a function of the projected distance from their cluster centre (in units of the cluster radius R200); left and right panels, respectively. The UDGs are marked as red hollow circles. The green line and the grey-shaded region are the linear best fit and the 1σ scatter for the cluster LSBGs, respectively. The blue dashed line is the linear best fit for the cluster UDGs.
Current usage metrics show cumulative count of Article Views (full-text article views including HTML views, PDF and ePub downloads, according to the available data) and Abstracts Views on Vision4Press platform.
Data correspond to usage on the plateform after 2015. The current usage metrics is available 48-96 hours after online publication and is updated daily on week days.
Initial download of the metrics may take a while.