Open Access
Fig. 23
Download original image
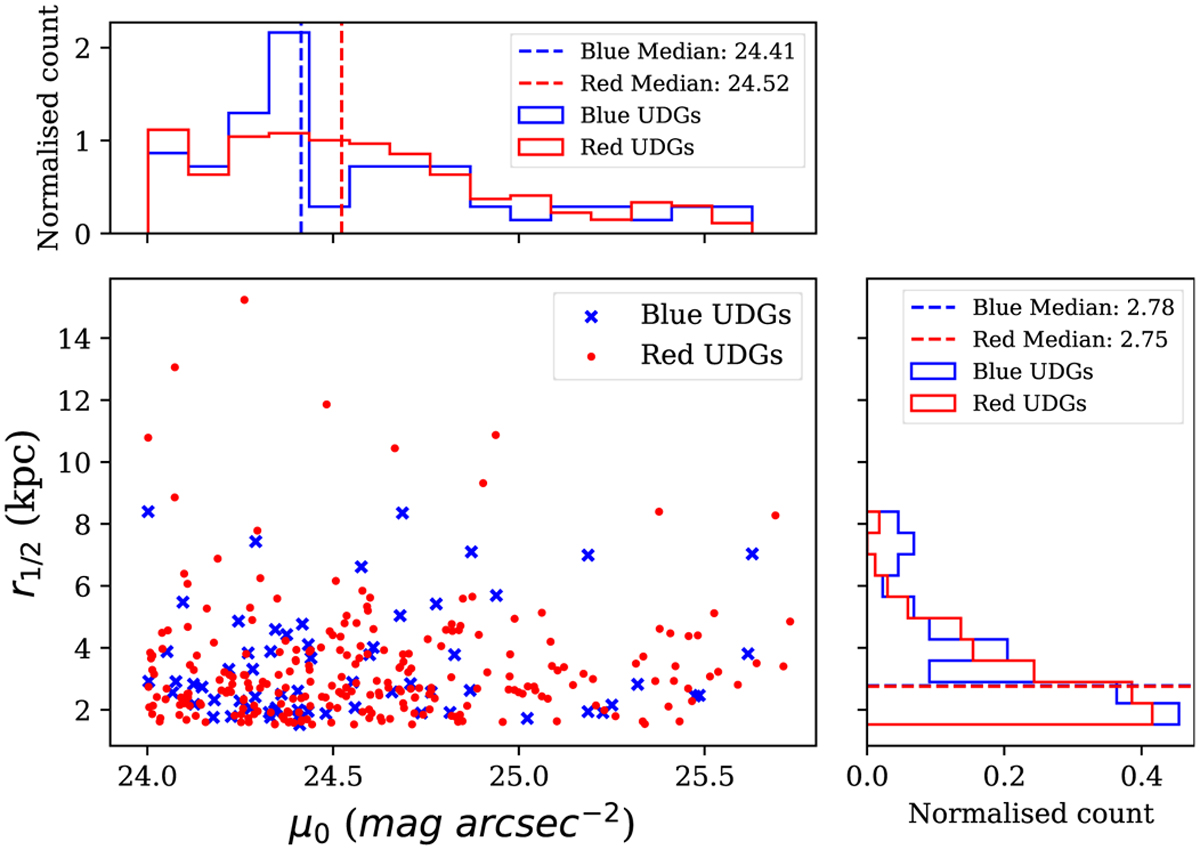
Joint distribution of the red (red dots) and blue (blue cross) UDGs in the space of r1/2 and µ0 in the ɡ-band. The vertical lines in the histogram on the x-axis and y-axis show the median for each class.
Current usage metrics show cumulative count of Article Views (full-text article views including HTML views, PDF and ePub downloads, according to the available data) and Abstracts Views on Vision4Press platform.
Data correspond to usage on the plateform after 2015. The current usage metrics is available 48-96 hours after online publication and is updated daily on week days.
Initial download of the metrics may take a while.