Fig. 20
Download original image
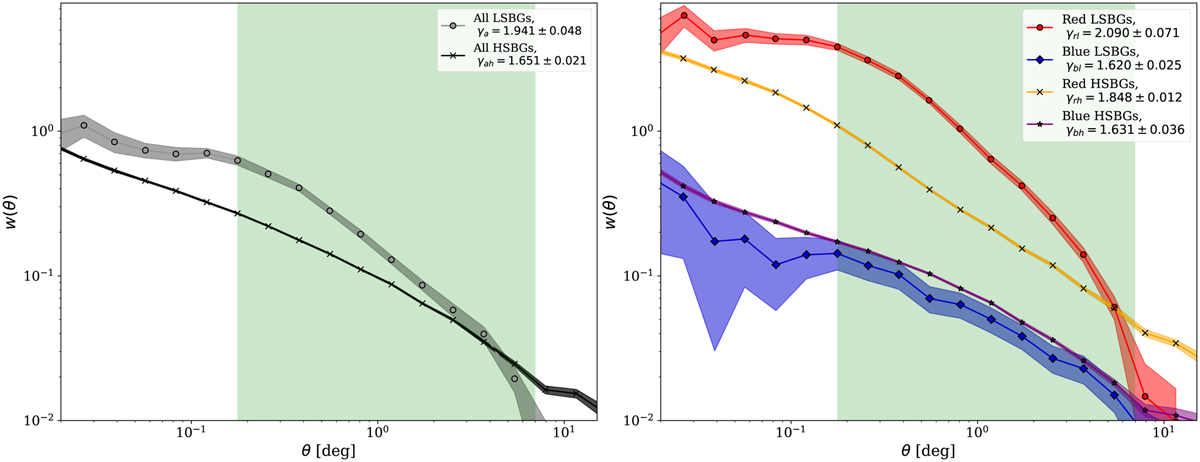
Angular autocorrelation function for the full sample of LSBGs (grey line with open circles) and the sample of HSBGs (black line with crosses) is shown in the left panel. The angular autocorrelation function of the red LSBGs (red line), blue LSBGs (blue line), red HSBGs (orange line), and blue HSBGs (purple line) is shown in the right panel. The vertical green shaded region represents the region fitted for a power law (ω = Aθ1–γ), and the corresponding γ values are shown in the legend.
Current usage metrics show cumulative count of Article Views (full-text article views including HTML views, PDF and ePub downloads, according to the available data) and Abstracts Views on Vision4Press platform.
Data correspond to usage on the plateform after 2015. The current usage metrics is available 48-96 hours after online publication and is updated daily on week days.
Initial download of the metrics may take a while.