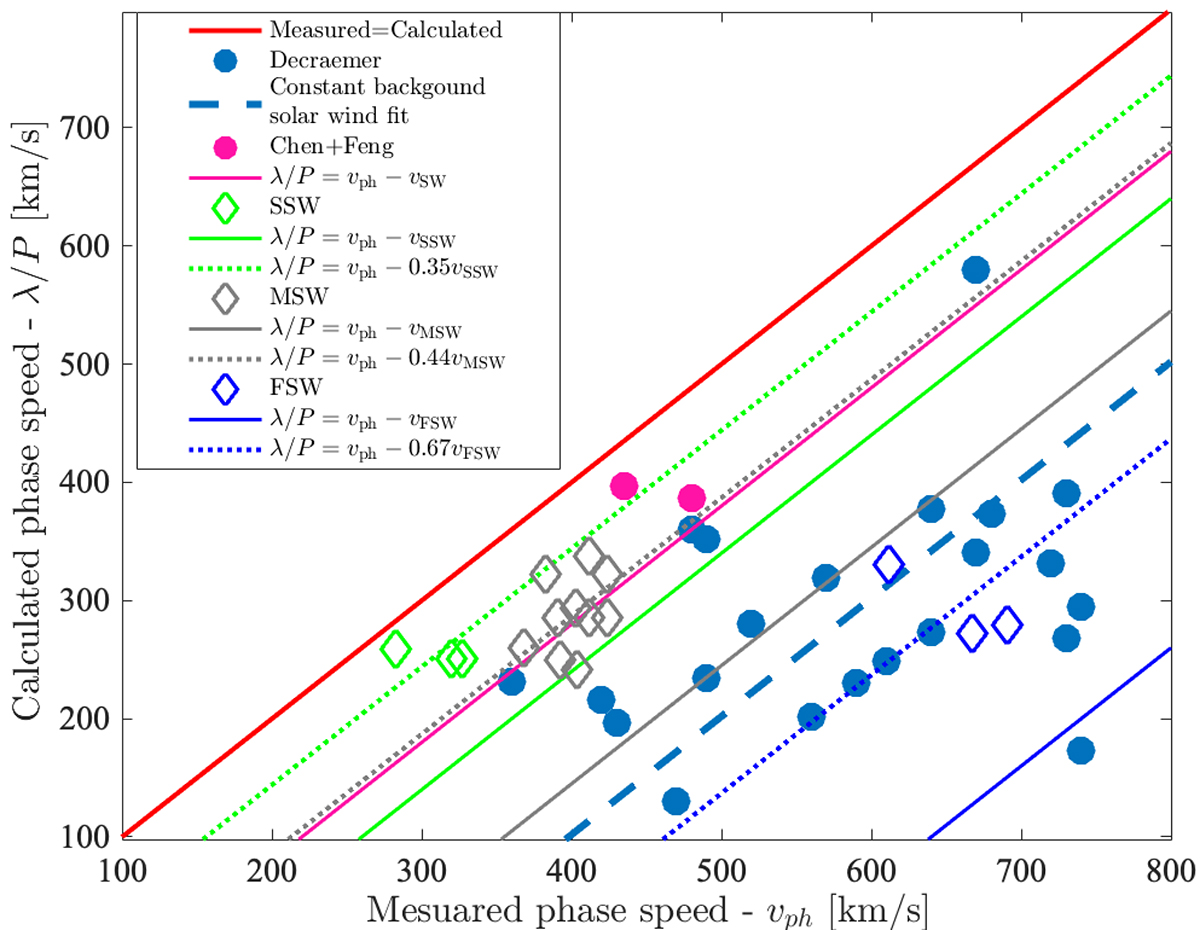
Fig. 9.
Download original image
Scatter plot of measured phase speed (vph) vs. calculated speed (λ/P) for the streamer wave events from observational studies and from simulations. Blue circles correspond to the events from Decraemer et al. (2020) and magenta circles correspond to the events from Table 2. Diamonds correspond to the modelling results, where green diamonds represent SSW variants, grey diamonds represent MSW variants, and blue diamonds represent FSW variants. The red line marks the equal values of the calculated and measured phase speed. The blue dashed line corresponds to a fit with a constant solar background wind (averaged difference between vph and λ/P). Solid lines correspond to the fit λ/P = vph − vSW, where vSW represents the averaged solar wind speed estimated from the observations or calculated from the modelling setup. Dotted lines correspond to the fit λ/P = vph − αvSW, where αvSW represents the averaged difference between vph and λ/P.
Current usage metrics show cumulative count of Article Views (full-text article views including HTML views, PDF and ePub downloads, according to the available data) and Abstracts Views on Vision4Press platform.
Data correspond to usage on the plateform after 2015. The current usage metrics is available 48-96 hours after online publication and is updated daily on week days.
Initial download of the metrics may take a while.