Fig. 6.
Download original image
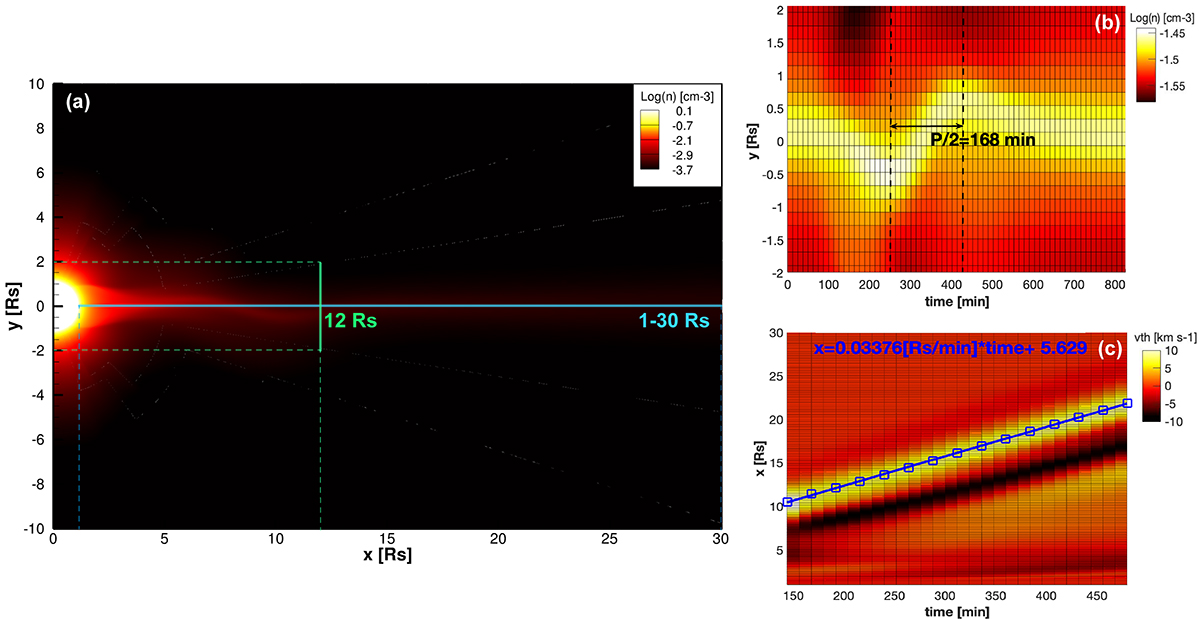
Example of determining the streamer wave properties. Panel a shows a simulation snapshot of the logarithmic density, depicting the streamer wave event B1T1.50. Green and light-blue lines show the slits along which the time–distance maps were constructed to determine the streamer wave properties. The colour scale in (a) corresponds to the logarithmic density. Panel b shows the time–distance map along the green slit in panel a. The black arrow in panel b indicates the half period measurement for the variant B1T1.50 (168 min). The colour scale in (b) corresponds to the logarithmic density. Panel c shows the time–distance map along the light-blue slit in panel a. The blue line is the linear fit corresponding to the phase speed (392 km s−1). The colour scale in (c) corresponds to the θ-velocity.
Current usage metrics show cumulative count of Article Views (full-text article views including HTML views, PDF and ePub downloads, according to the available data) and Abstracts Views on Vision4Press platform.
Data correspond to usage on the plateform after 2015. The current usage metrics is available 48-96 hours after online publication and is updated daily on week days.
Initial download of the metrics may take a while.