Fig. 5.
Download original image
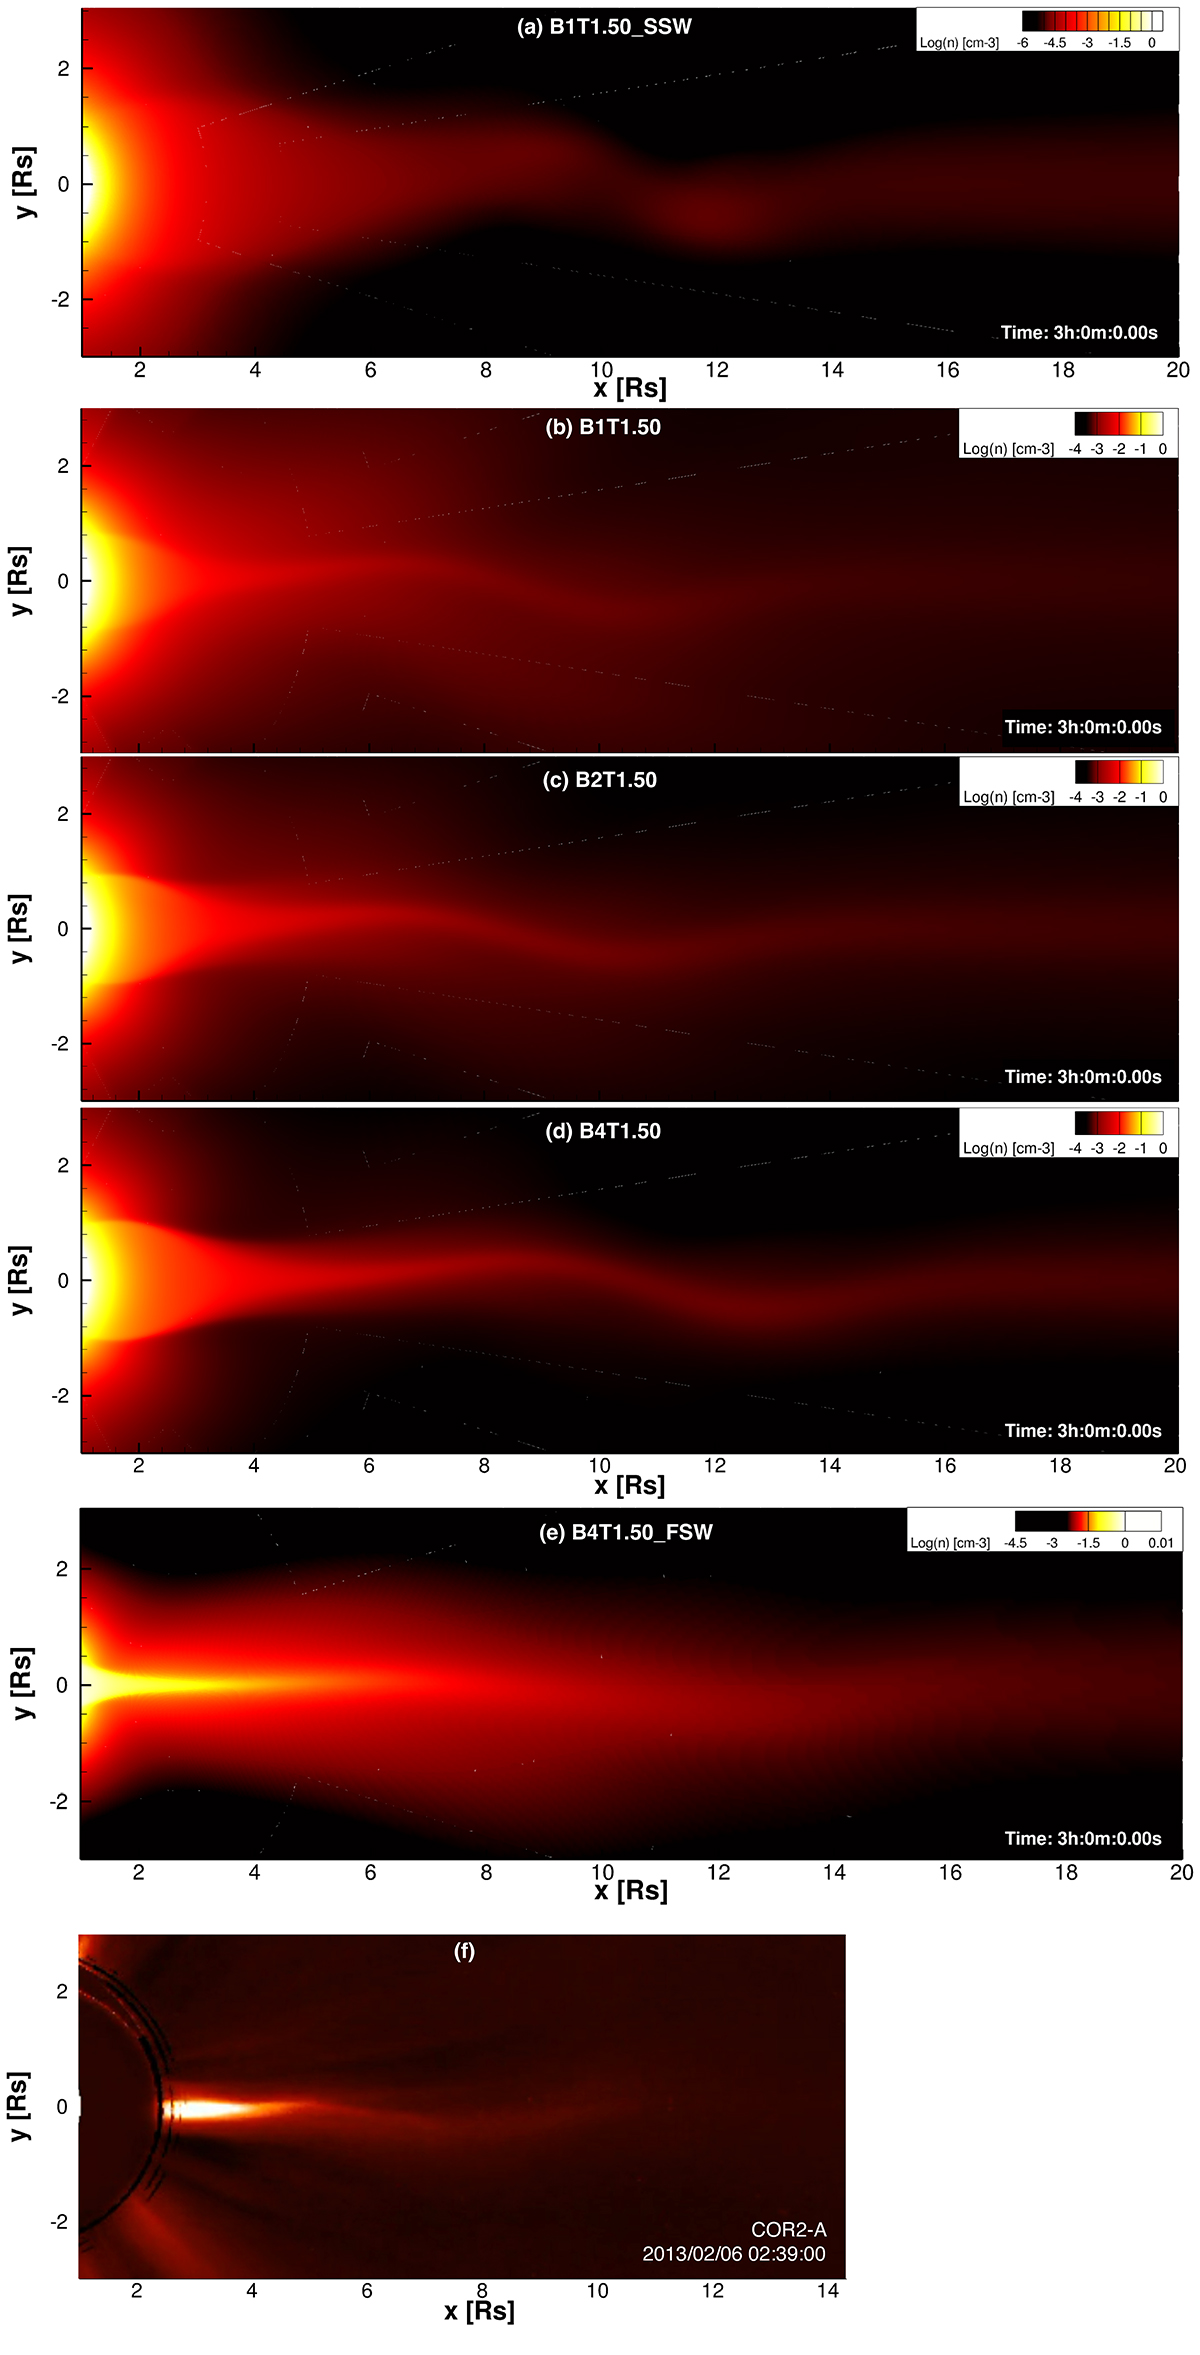
Comparison of the simulation results with the observation. Panels a–e: Snapshots of the logarithmic density (colour scale) of the variants corresponding to the T = 1.50 K 3 h after introducing the perturbation. Panel f: STEREO A/COR2 white-light image of the streamer wave event on 2013 Feb. 6 at 02:39:00 (∼2 h after the start of the event).
Current usage metrics show cumulative count of Article Views (full-text article views including HTML views, PDF and ePub downloads, according to the available data) and Abstracts Views on Vision4Press platform.
Data correspond to usage on the plateform after 2015. The current usage metrics is available 48-96 hours after online publication and is updated daily on week days.
Initial download of the metrics may take a while.