Fig. 3.
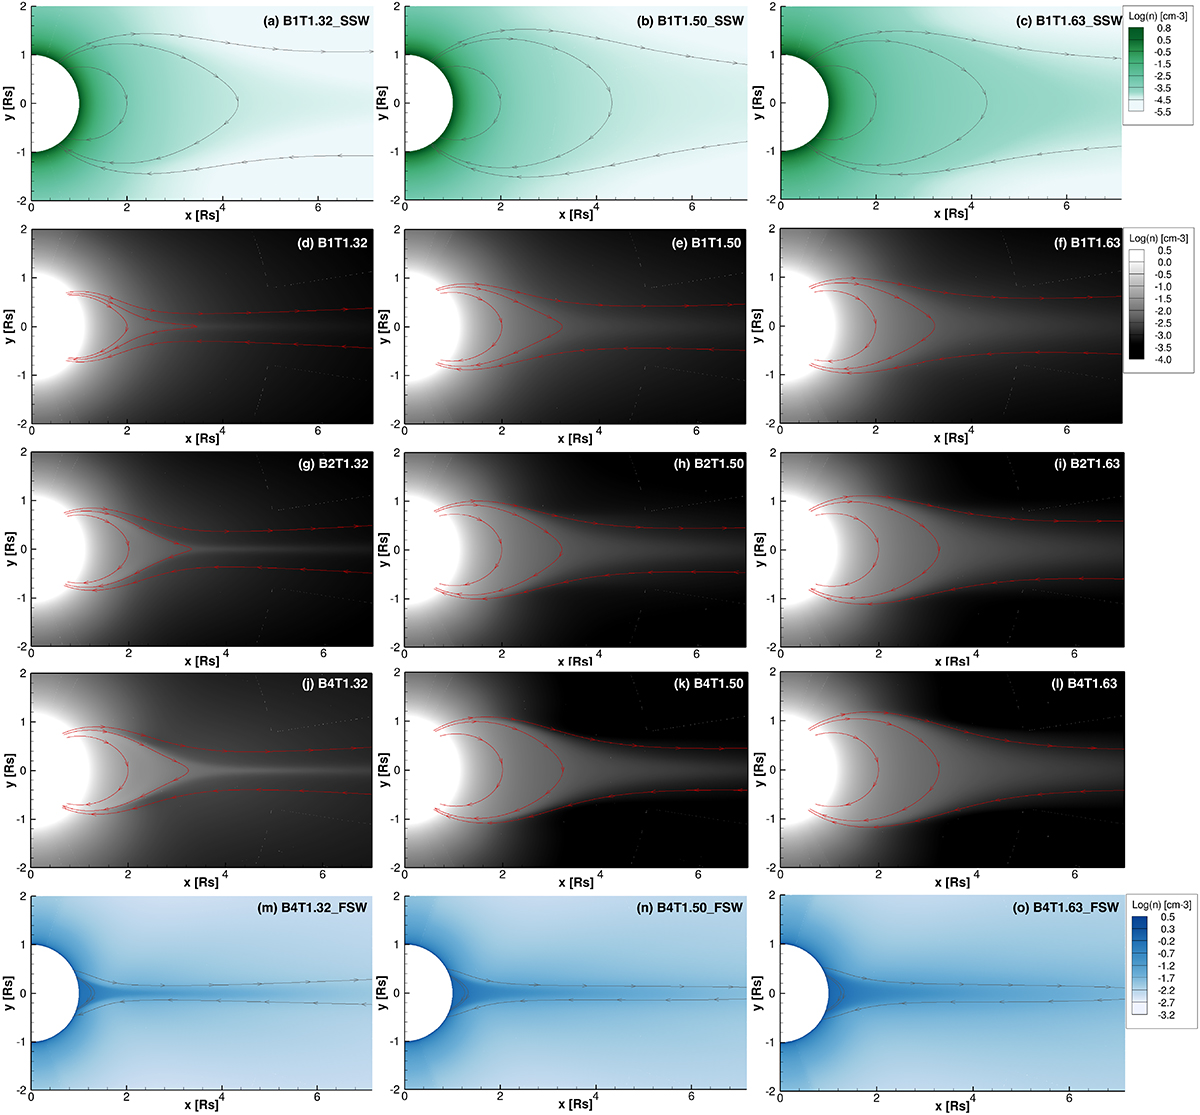
Download original image
Snapshots of the logarithmic number density (colour scale) and selected magnetic field lines for 15 variants in the parameter study. The green panels (top row) correspond to SSW, the grey panels (rows 2–4) to MSW; and the blue panels (bottom row) to FSW. The magnetic field strength increases from top to bottom within columns, and the temperature increases from left to right within rows. The colour scales are different for the different solar wind regimes.
Current usage metrics show cumulative count of Article Views (full-text article views including HTML views, PDF and ePub downloads, according to the available data) and Abstracts Views on Vision4Press platform.
Data correspond to usage on the plateform after 2015. The current usage metrics is available 48-96 hours after online publication and is updated daily on week days.
Initial download of the metrics may take a while.