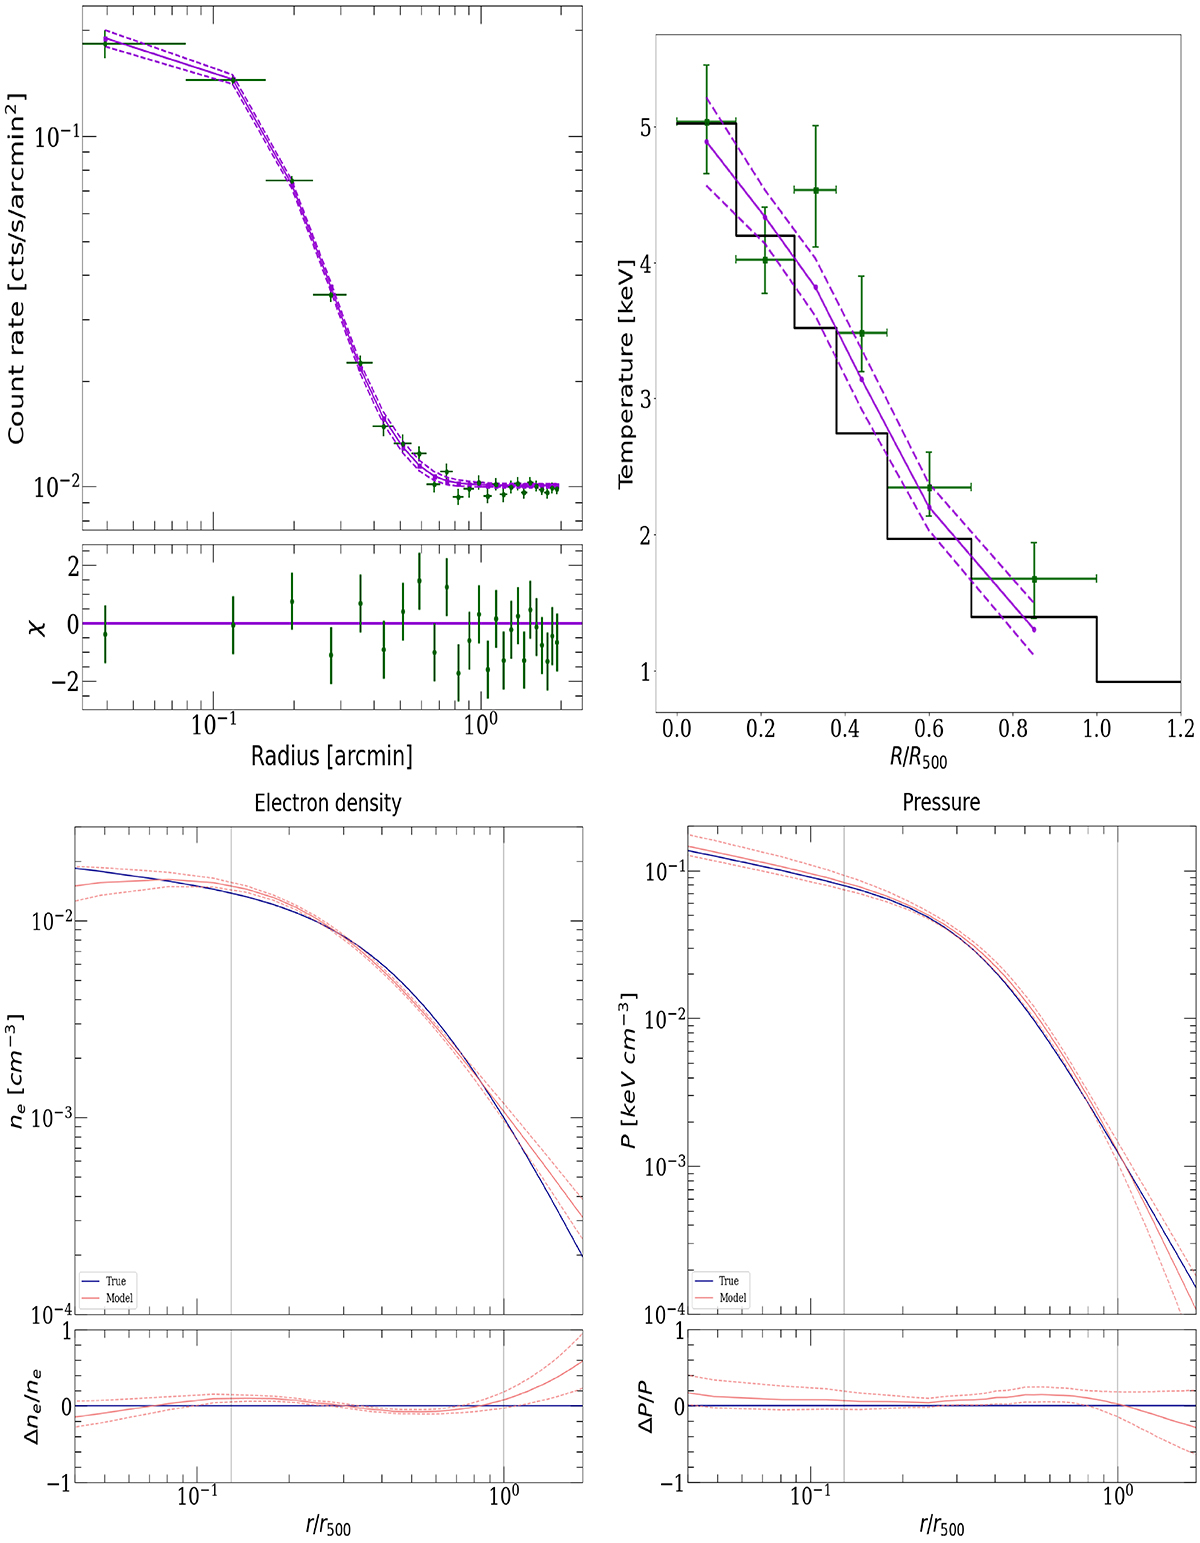
Fig. A.1.
Download original image
Validation of the forward-modelling procedure. The input model is a spherically symmetric cluster at z = 2, transformed into a 100 ks mock X-IFU observation. Top left: Surface brightness profile from the mock 0.4–1 keV image (green points and errors). The posterior mean (best-fit model) and the 68% confidence range appear as a purple solid line and dashed envelope. The sub-panel represents the difference between measurements and the best-fit model, normalised by the uncertainties. Top right: 2D temperature profile measured from X-IFU mock events using XSPEC (green points and errors). The emission-measure-weighted temperature TEM known as input is displayed as a thick black line. The posterior mean (best-fit model) and the 68% envelope are shown in purple (solid and dashed lines, respectively). Bottom panels: Inferred electron density (left) and pressure (right) profiles are represented with the red line and dashed envelope (68% confidence level). The input profiles are in blue, and follow Eqs. 4 and 5, respectively. The two sub-panels represent the deviation of the best-fit models relative to the true input profiles. The range of fidelity of our fit is located between the PSF size (indicated with the leftmost vertical dashed line) and R500 (rightmost line).
Current usage metrics show cumulative count of Article Views (full-text article views including HTML views, PDF and ePub downloads, according to the available data) and Abstracts Views on Vision4Press platform.
Data correspond to usage on the plateform after 2015. The current usage metrics is available 48-96 hours after online publication and is updated daily on week days.
Initial download of the metrics may take a while.