Fig. 3.
Download original image
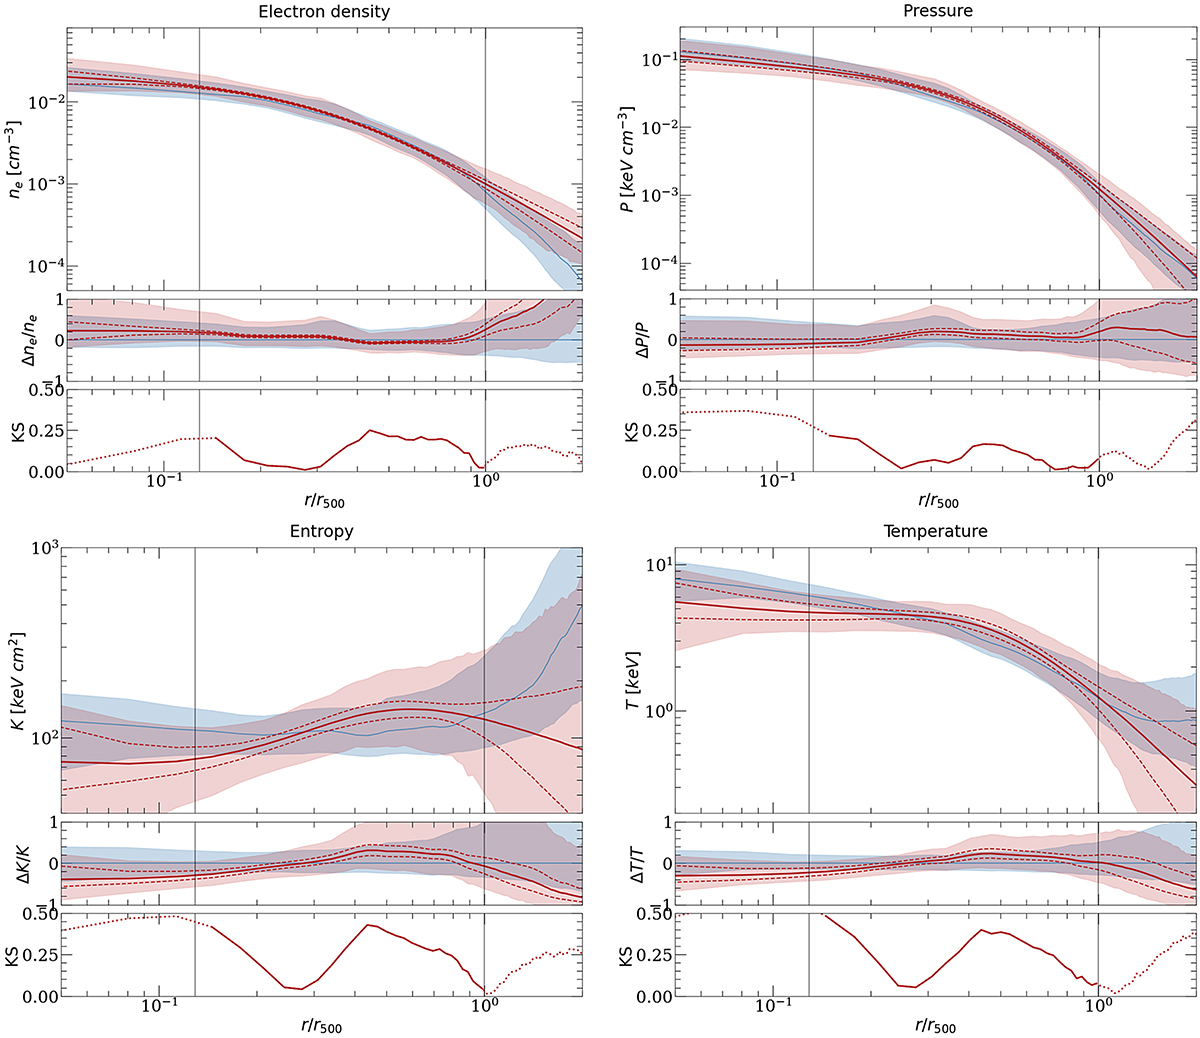
Three-dimensional thermodynamic quantities (in blue) for the z = 2 galaxy cluster with regular projection in the Hydrangea sample, and their best-fit models inferred from an X-IFU 100 ks exposure (in red). Each panel representing one quantity is made up of three plots. The top curve displays the radial profiles; the blue shaded envelope represents the dispersion of the gas particles in the hydro-simulation. The red dashed lines indicates the effect of the variance of the 14 free model parameters; the shaded envelope also includes the radial dispersion encapsulated in our model. The middle plot represents the deviation of the profile relative to the input median profile. The bottom plot shows the results of a Kolmogorov–Smirnov (KS) test performed at each radius r/r500, related to the probability that the input and best-fit profiles do not originate from the same distribution (the lower the KS, the closer the agreement between the profiles). The vertical lines indicate the range of applicability of our modelling procedure.
Current usage metrics show cumulative count of Article Views (full-text article views including HTML views, PDF and ePub downloads, according to the available data) and Abstracts Views on Vision4Press platform.
Data correspond to usage on the plateform after 2015. The current usage metrics is available 48-96 hours after online publication and is updated daily on week days.
Initial download of the metrics may take a while.