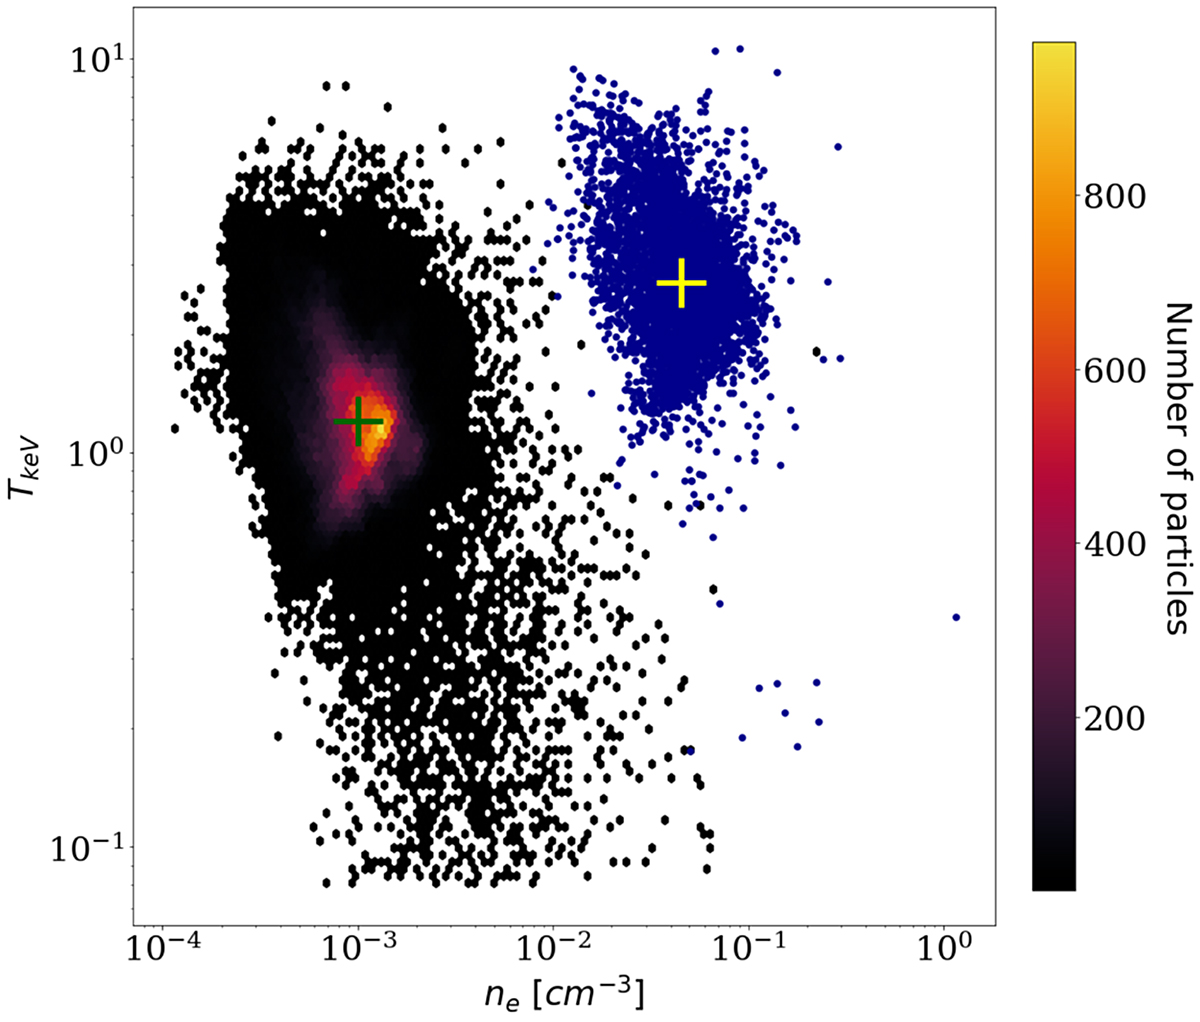
Fig. 2.
Download original image
Dispersion of thermodynamic quantities (electronic density ne in units of cm−3, and temperature T in units of keV) in one radial shell with 300 kpc < r < 310 kpc of the z = 2 cluster. The left cloud is a density map of extracted particles from the Hydrangea-simulated cluster. The green cross on the left indicates the position of the median density and temperature. The cloud of 5000 blue points on the right illustrates our random generation of a new model, when requesting a new set of median values (as shown by the yellow cross on the right). In this process, the shape of the dispersion in the log − log plane is essentially maintained fixed and translated.
Current usage metrics show cumulative count of Article Views (full-text article views including HTML views, PDF and ePub downloads, according to the available data) and Abstracts Views on Vision4Press platform.
Data correspond to usage on the plateform after 2015. The current usage metrics is available 48-96 hours after online publication and is updated daily on week days.
Initial download of the metrics may take a while.