Fig. 6.
Download original image
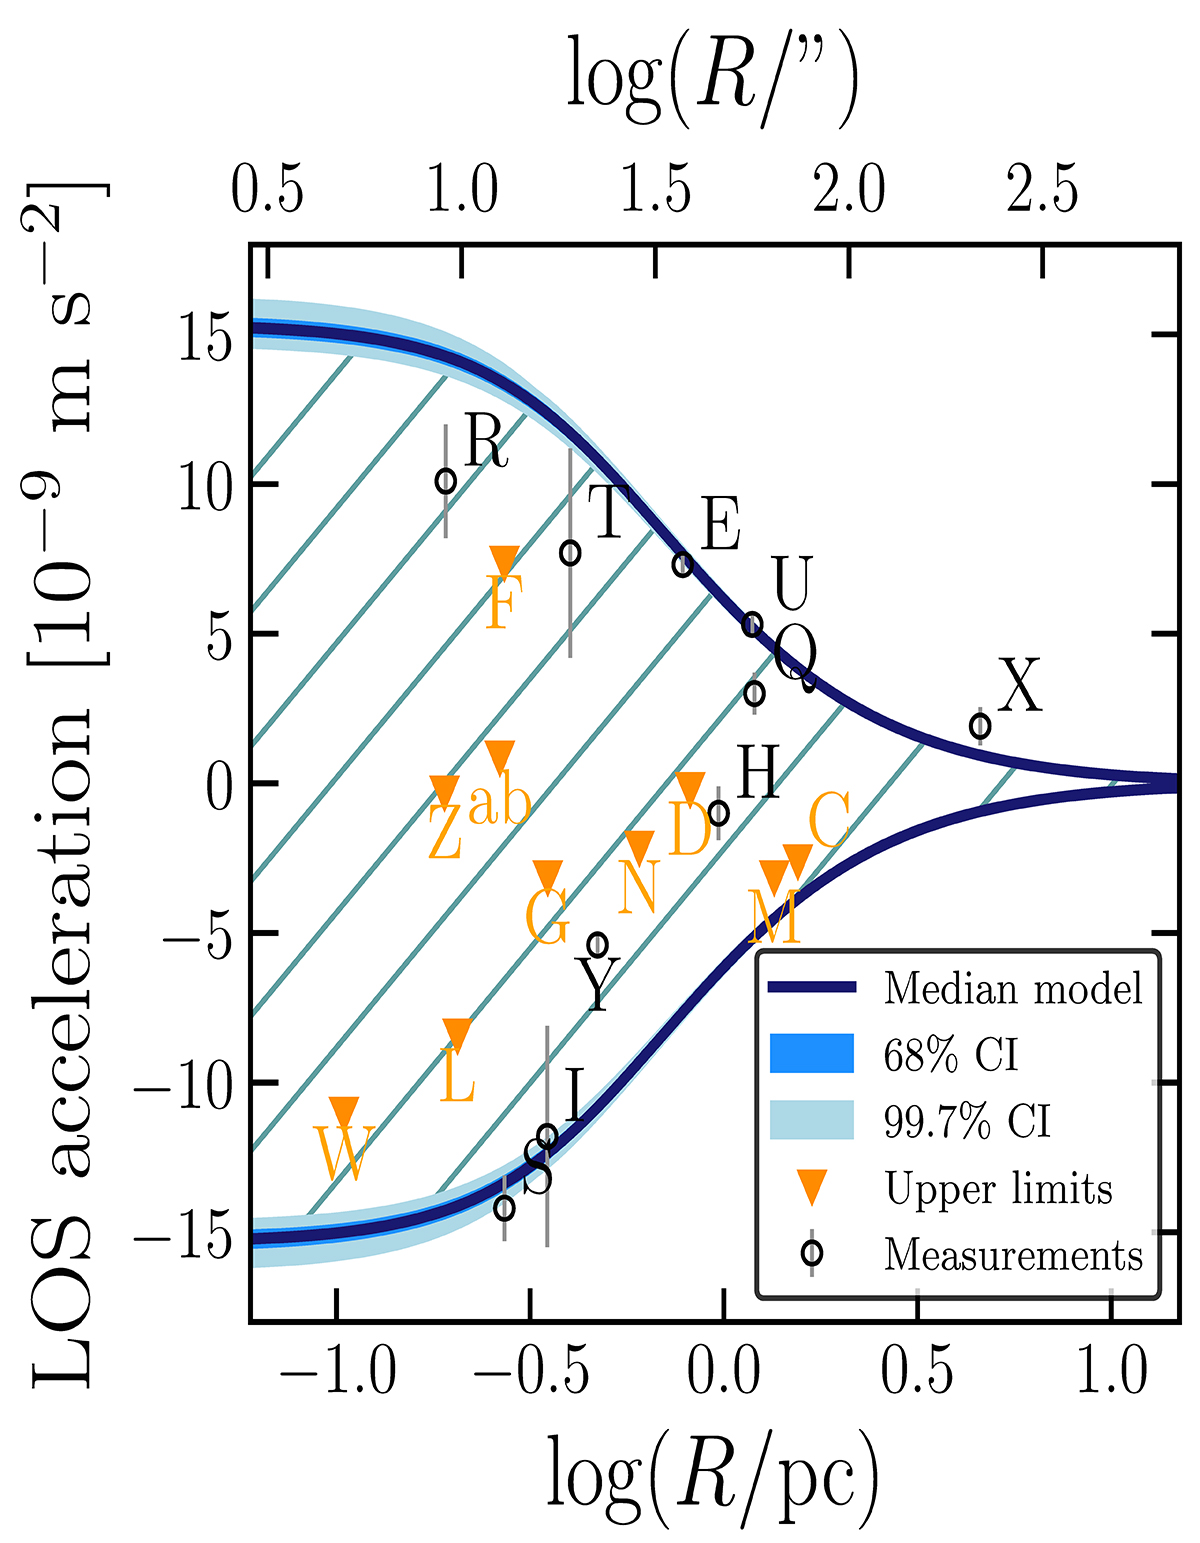
LOS acceleration as a function of the projected distance from the center of 47 Tucanae. Black points are measurements, while orange ones are upper limits. Both were obtained from pulsars (data from Ridolfi et al. 2016; Freire et al. 2017). The label of each pulsar is shown either in orange or black. The blue line shows the maximum (if positive) and minimum (if negative) LOS acceleration allowed by our dynamical model at a given distance from the center. Similarly, the 68% and 99.7% CIs on the maximum and minimum LOS acceleration are shown as shaded areas. The hatched area is the allowed LOS acceleration space.
Current usage metrics show cumulative count of Article Views (full-text article views including HTML views, PDF and ePub downloads, according to the available data) and Abstracts Views on Vision4Press platform.
Data correspond to usage on the plateform after 2015. The current usage metrics is available 48-96 hours after online publication and is updated daily on week days.
Initial download of the metrics may take a while.