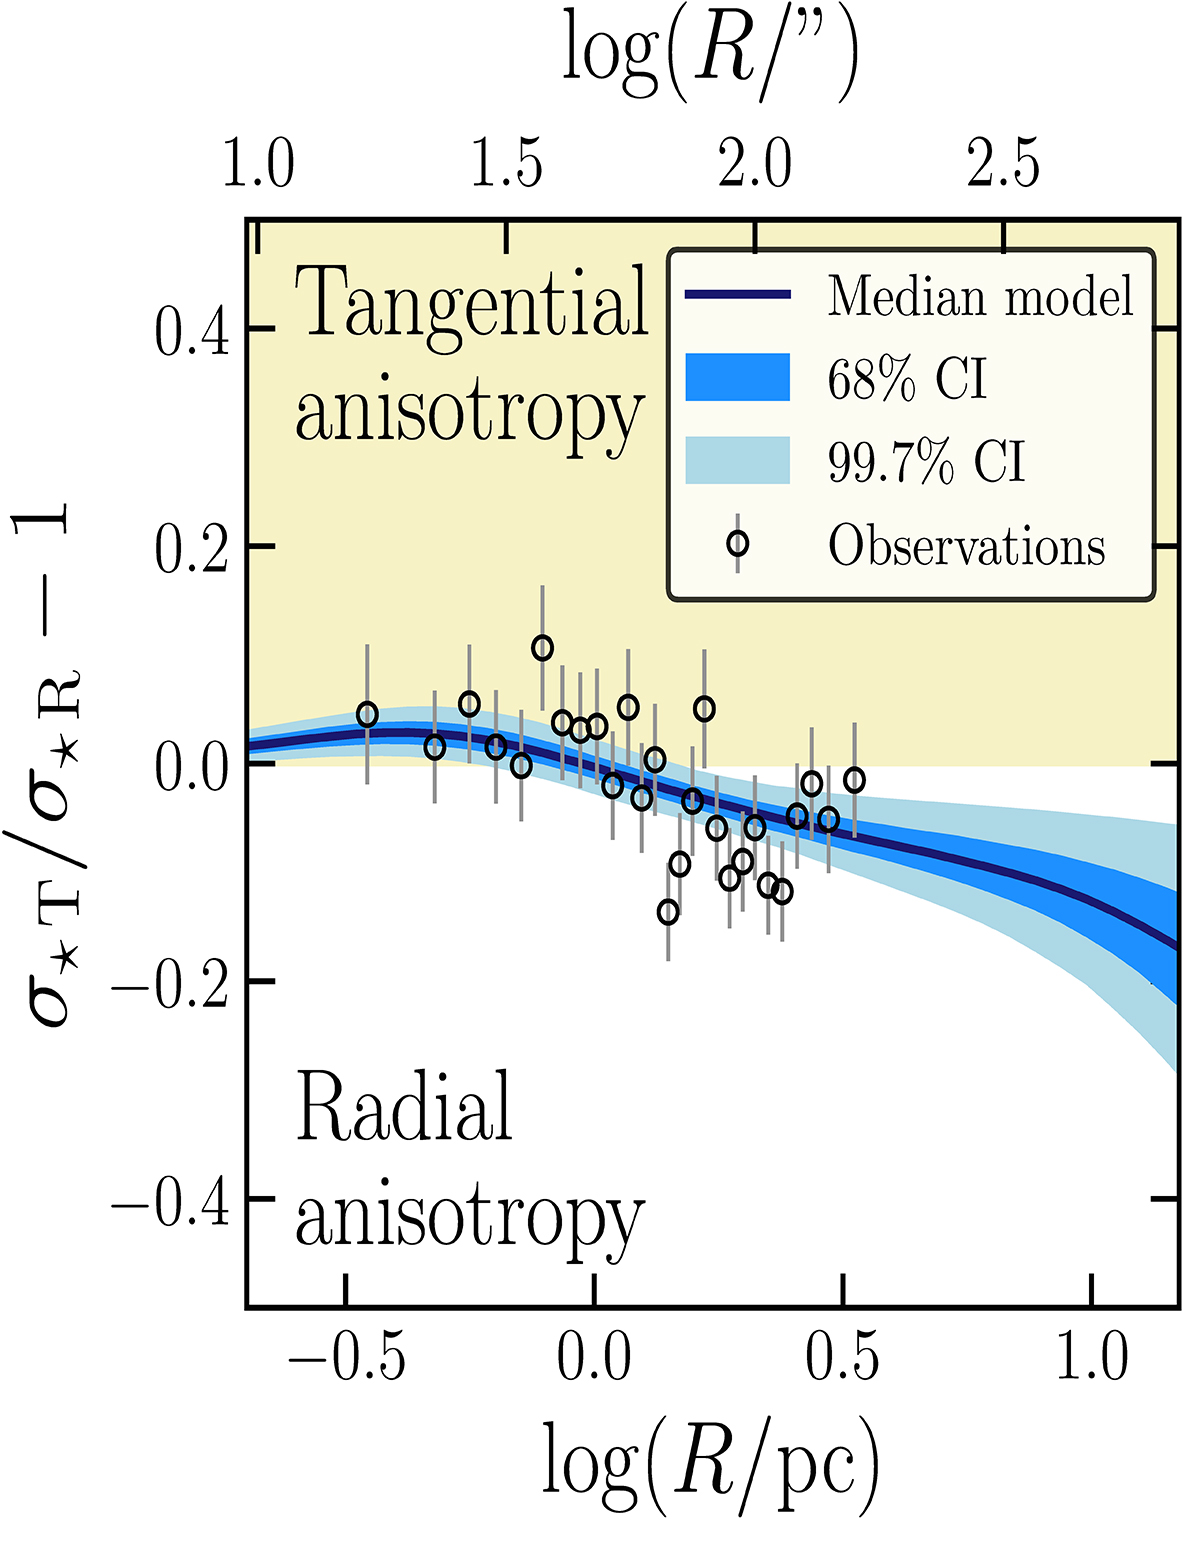
Fig. 5.
Download original image
Projected velocity anisotropy. Positive values of the anisotropy parameter correspond to tangential anisotropy, whereas negative ones to radial anisotropy. The median model is shown in blue and the corresponding CIs are shown as shaded areas. The black points are observational data from Libralato et al. (2022) with 1σ error bars.
Current usage metrics show cumulative count of Article Views (full-text article views including HTML views, PDF and ePub downloads, according to the available data) and Abstracts Views on Vision4Press platform.
Data correspond to usage on the plateform after 2015. The current usage metrics is available 48-96 hours after online publication and is updated daily on week days.
Initial download of the metrics may take a while.