Open Access
Fig. 4.
Download original image
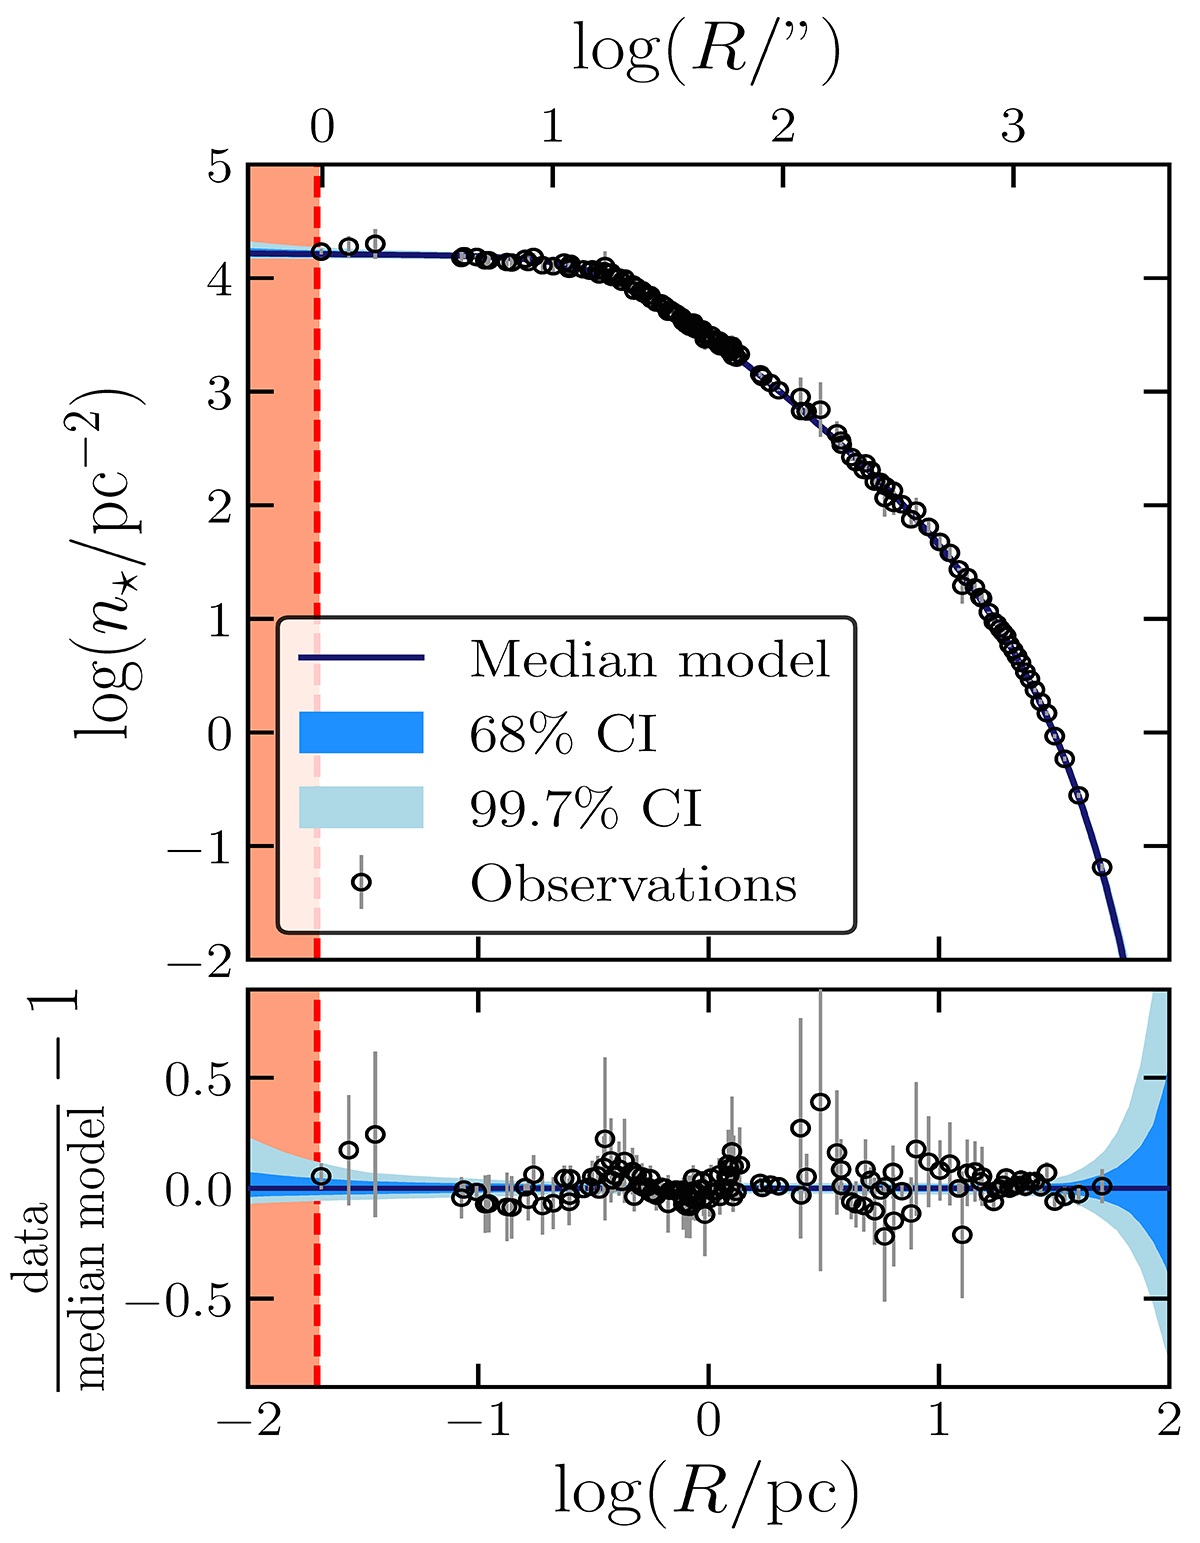
Surface number density as a function of the projected distance from the cluster center. Observations are shown as black points (with 1σ error bars), whereas the model is shown in blue. The 68% and 99.7% CIs are also shown as shaded areas. The vertical dashed line represents the 3σ upper limit (0.02 pc) on the BH Rinfl.
Current usage metrics show cumulative count of Article Views (full-text article views including HTML views, PDF and ePub downloads, according to the available data) and Abstracts Views on Vision4Press platform.
Data correspond to usage on the plateform after 2015. The current usage metrics is available 48-96 hours after online publication and is updated daily on week days.
Initial download of the metrics may take a while.