Open Access
Fig. 3.
Download original image
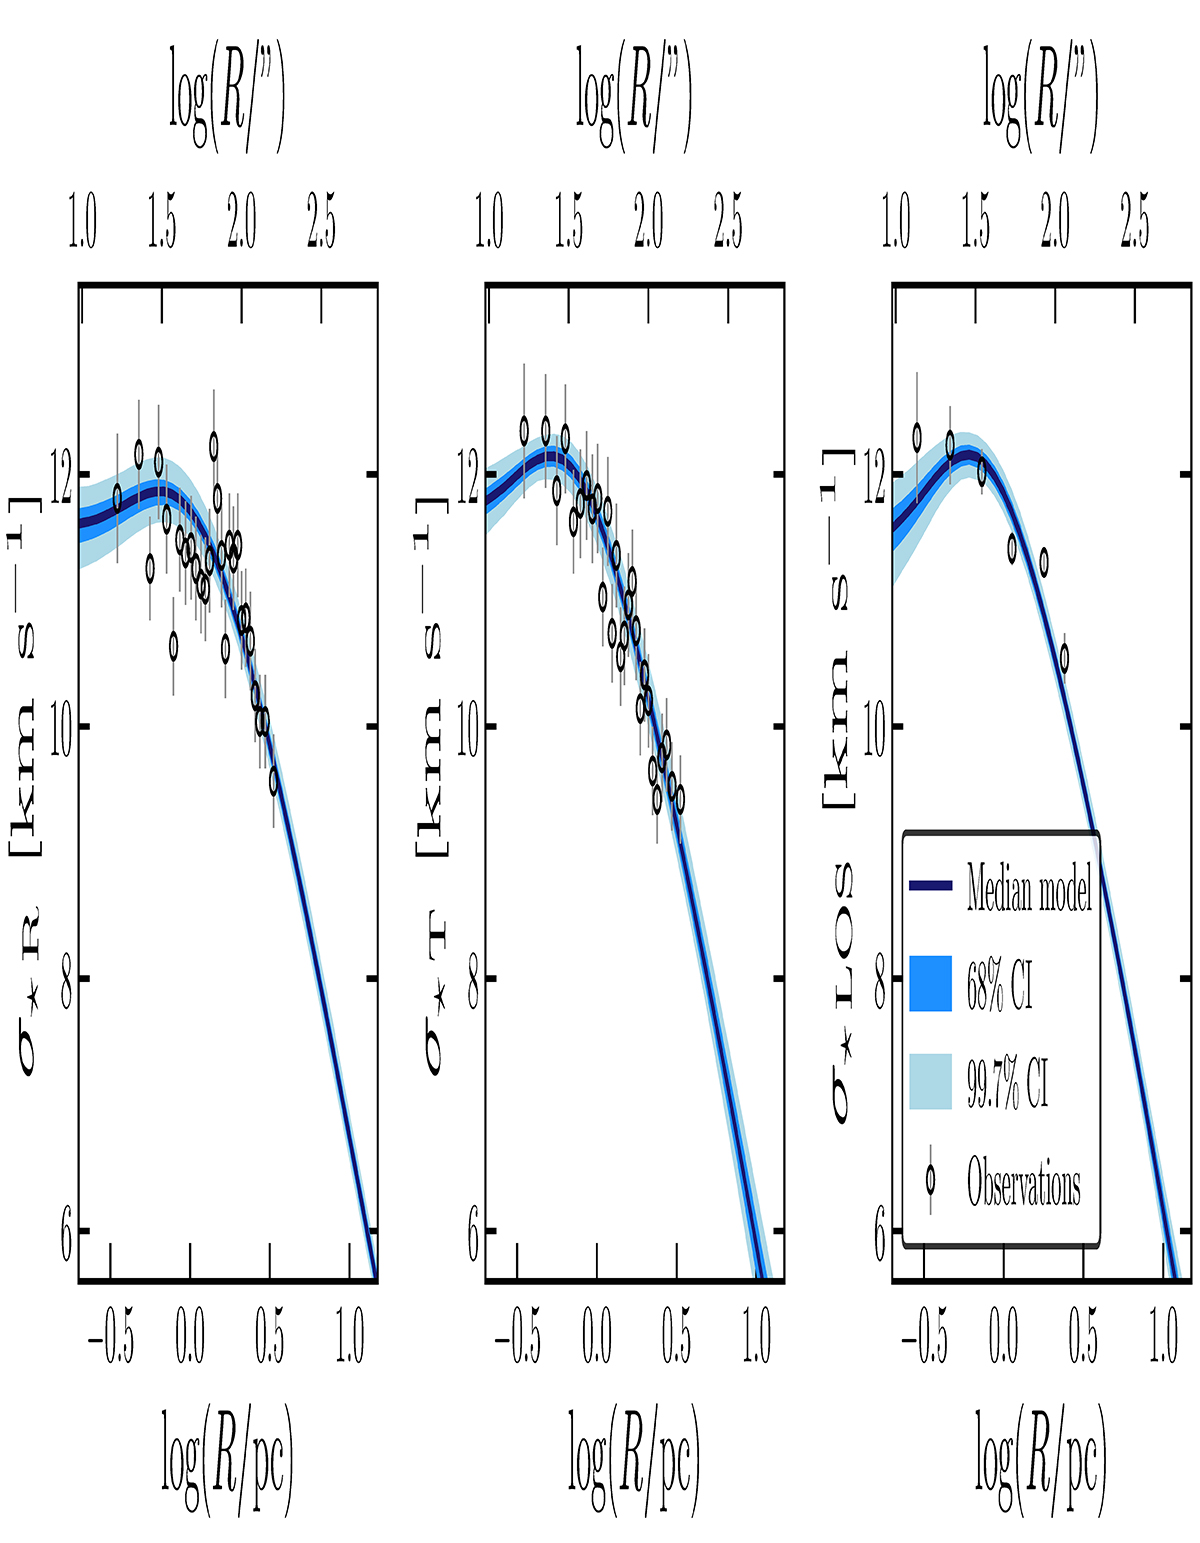
Projected velocity dispersion profiles along the radial (left panel), tangential (central panel), and LOS (right panel) directions. Observations are shown as black points along with 1σ error bars. The blue line is the median model, while the shaded areas represent the 68% and the 99.7% CIs.
Current usage metrics show cumulative count of Article Views (full-text article views including HTML views, PDF and ePub downloads, according to the available data) and Abstracts Views on Vision4Press platform.
Data correspond to usage on the plateform after 2015. The current usage metrics is available 48-96 hours after online publication and is updated daily on week days.
Initial download of the metrics may take a while.