Fig. 2.
Download original image
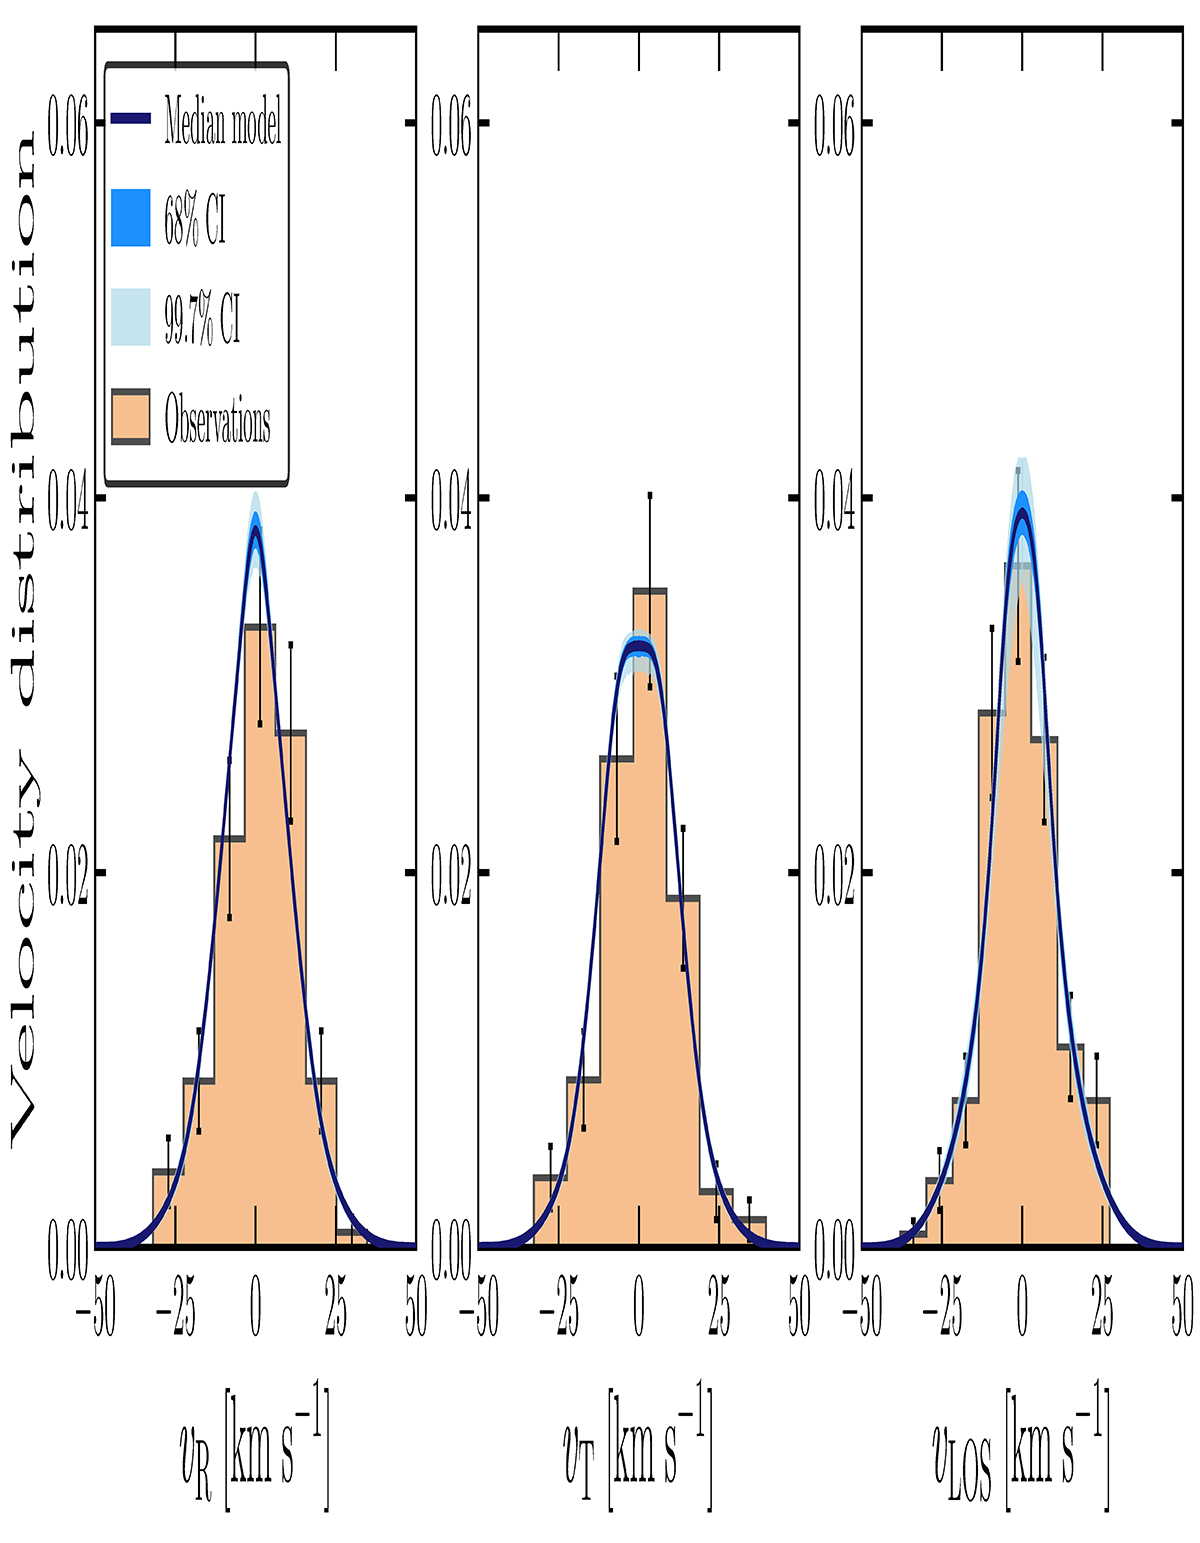
Observed velocity distribution within 12″ from the cluster center, along the radial (left panel), tangential (central panel), and LOS (right panel) directions. The bars indicate uncertainties estimated as Poissonian errors on the bin counts. The median models (solid line), 68% (1σ), and 99.7% (3σ) CIs (shaded areas) are shown in blue (see text for details).
Current usage metrics show cumulative count of Article Views (full-text article views including HTML views, PDF and ePub downloads, according to the available data) and Abstracts Views on Vision4Press platform.
Data correspond to usage on the plateform after 2015. The current usage metrics is available 48-96 hours after online publication and is updated daily on week days.
Initial download of the metrics may take a while.